A few things to think about for colocalization.
For this simulation, we are going to reduce a Point Spread Function (PSF), which is the smallest spot of light your can get from the microscope with a given set of optics, to a 2 dimensional circle 200 nm in diameter. This is gross simplification, but makes understanding the relationship between molecules and a pixel in your image easier. (It's also heresy to reduce a PSF to a pixel, but we're doing it anyhow.)
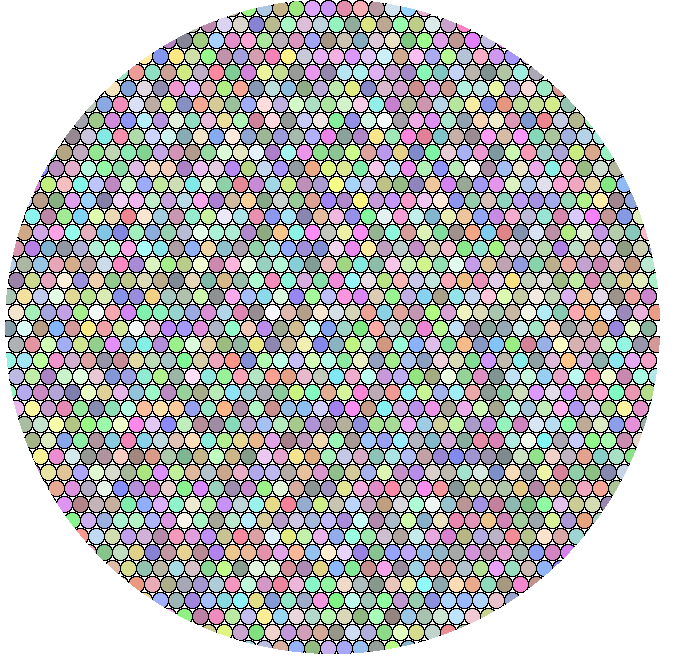
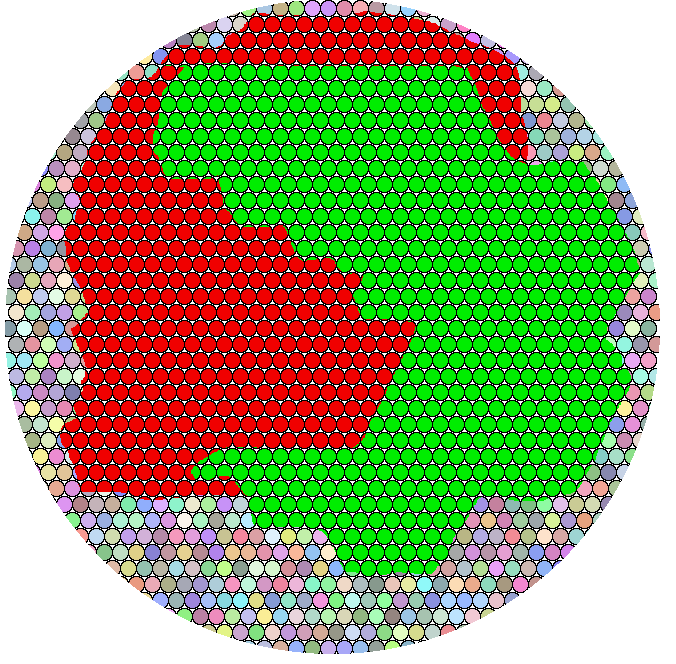
The big circle has a diameter of 40 little randomly colored circles. (You can count to check, or trust the loops in this macro.)
This is supposed to be an illustration of how many fluorescent labeled molecules may be represented by a single pixel of the highest resolution confocal microscope image. I based this number on the smallest possible light spot being 200 nm and each molecule 50 angstroms. Even if we quibble over the precision of the sizes, there are a lot of molecules.
To complicate matters, each 2D pixel in a confocal image would also include light from above and below the plane, at this scale, at least 60 of more molecules deep.
But for illustration, we will keep this simple as a 2D circle.
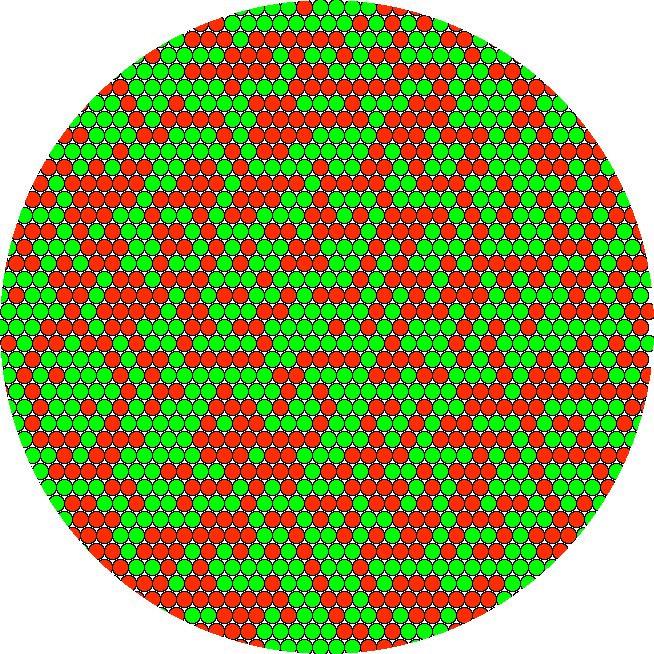
This circle has approximately the same number of red and green molecules. Think of them as two proteins you have labeled in your sample or a mixture of rhodamine and fluoroscein in solution. The red and green molecules are distributed randomly. (Code here.) This would produce a bright yellow pixel you would call colocalized.
![]()
By fluorescence, they would all be added together and presented as a bulk answer.
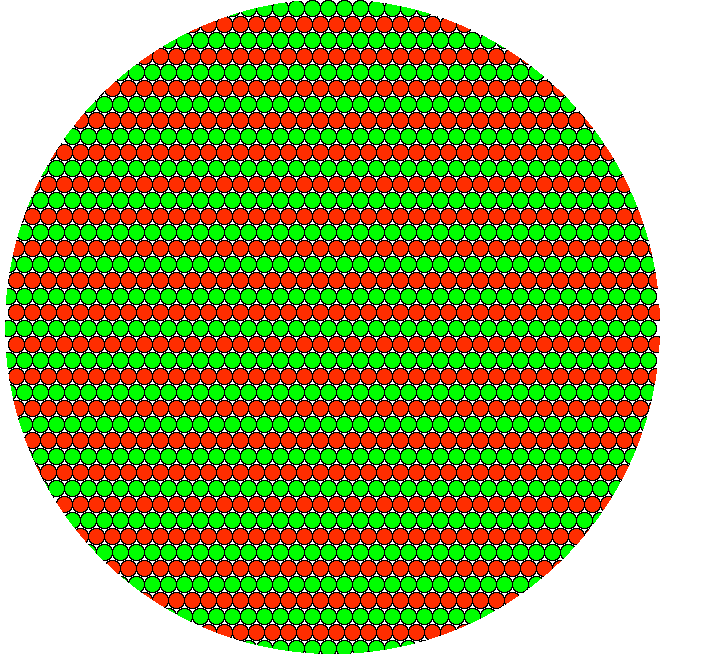
Red and green molecules highly ordered in neat rows would result in precisely the same yellow pixel result.
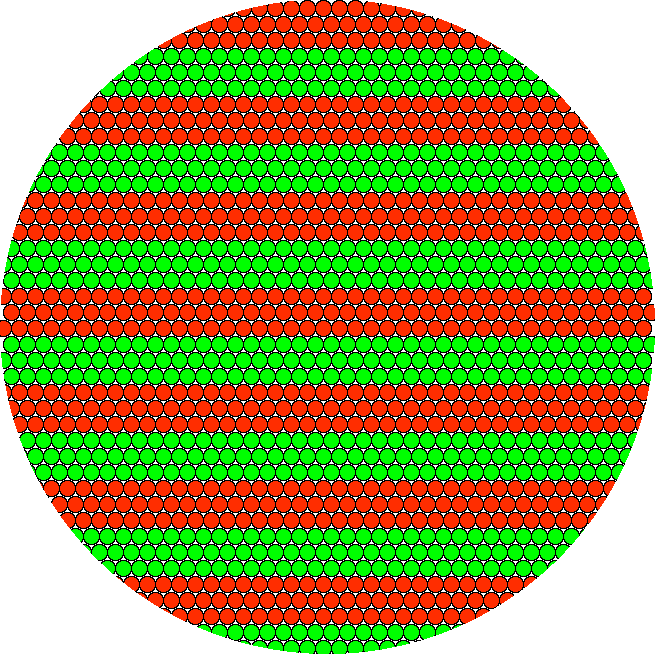
And molecules arranged in wider bands would also result in the precise same yellow pixel. Because the pattern is sub-diffraction, it cannot be resolved. (In real imaging, if molecules were this ordered, there might be problems such as polarization etc., but this is a simplified illustration of number of molecules per area.) Also, you could reorder the molecules into a checkerboard pattern or random patches; the result of approximately equal number of molecules packed toegther would be the same.
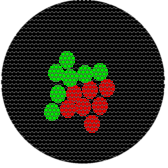
Of course, biological samples are not this ordered. This, too, will display as a yellow pixel. The random colors represent unlabeled molecules and there are two labeled aggregates stuck together, but we know nothing about their structure. We don't know if they are aggregates or stripes or even if they are interacting. Especially if they present as puncta against a dark background, a reasonable conclusion is that they are recruited to a location for a specific function, but we do not know what their arrangement is. Maybe they never interact but they are needed in sequence for the steps in another process.
Actually, all the examples until this loast one would not have produced a single pixel. If isolated from their neighbors, they would have produced a few pixels fitting to a Gaussian intensity profile or, assuming the trend you see extend to their neighbors, a yellow field.
Consider that for testing our microscopes, we often use 100 nm fluorescent beads and we call them point sources. If one half of the bead were red and the other half green, the light would appear to come from a single point.
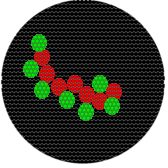
We are doing fluor microscopy, so we are going to switch the diagrams a little. This drawing depicts the same hypothetical phenomena as circle above, a collection of fluorescence molecules against a dark background resulting in a single yellow pixel.
 .
. ![]()
The following relationships at a spatial scale in the 100 nm range would also result in a single yellow pixel. Note that in each image, molecules have very different spatial relationships to each other.
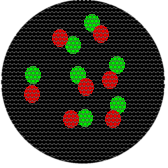
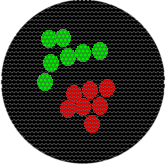
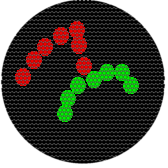
Also, although the intensity would change, a single fluorescent molecule or 100 molecules would result in the same size spot.
Given that a yellow pixel is our metric of successful colocalization, what can colocalization tell us by itself? Molecules are recruited to the same spatial compartment defined as an ovoid approximately 200 nm in diameter in XY and 500 nm deep in Z. We have no evidence the molecules interact directly or or in any particlar spatial arrangement. Other data are required to support specific scenarios.
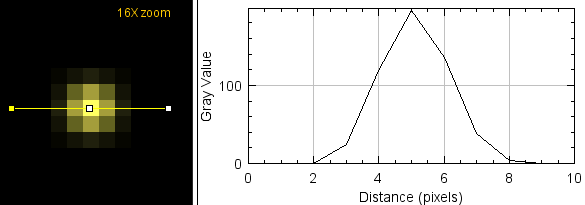
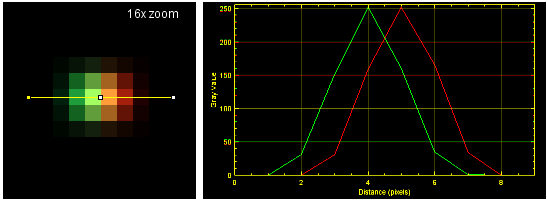
You never will get a single yellow pixel (or voxel). Because of how optics work, there will be a Gaussian distribution from a cental spot (when best focus).
![]()
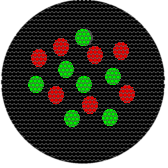
When these pixels are packed together to form an image, there is overlap of signal from neighboring structures. Therefore, even when two distinct fluorescent molecules are at a distance of 200+ nm, they will appear yellow. This does not mean that you cannot conclude that they are distinct objects, but a judgement based on pixel color, intensity ratio, or a readout such as Pearson't correlation (which is based on itensity) will argue for colocalization.
![]()
Are objects in close apposition always, randomly, what are functional reasons why they are close together?
If labeling were perfectly colocalized, we would expect a micrograph to look like this. (See explanation here with expansion on discussion of offset pixels.)
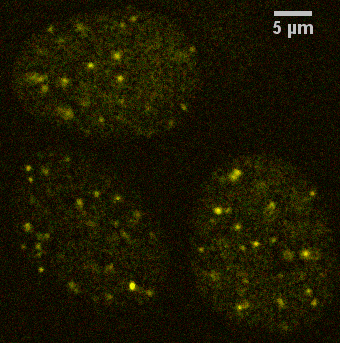
In contrast, the following example of staining of protein aggregates in the nucleus of a mammalian cell prepared in culture is an example where there is not colocalization based on a single pixel.
Note that this was imaged with a N.A. 1.4 lens, confocal pinhole at 1 Airy unit, with zoom set for each pixel 0.096 um, therefore each pixel is diffraction limited.
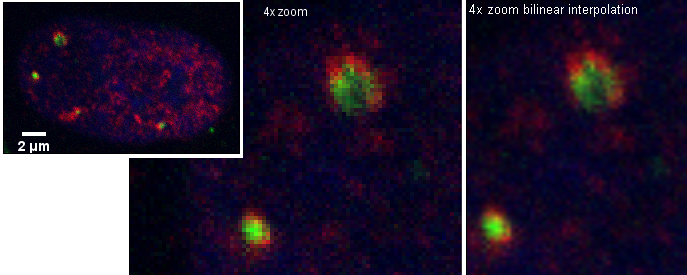
However, if colocalization is defined as being per object, then perhaps this complex or single object shows colocalization. The term "colocalization" needs to be defined for each use.
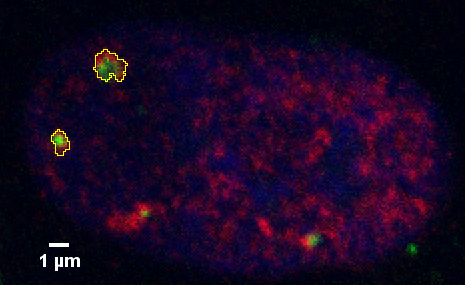
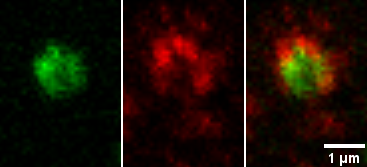
This leads to the possibility of measuring on a per object basis how much of the object is green, how much is red, and how much is overlap.
The outlines of the object were defined by intensity threshold.
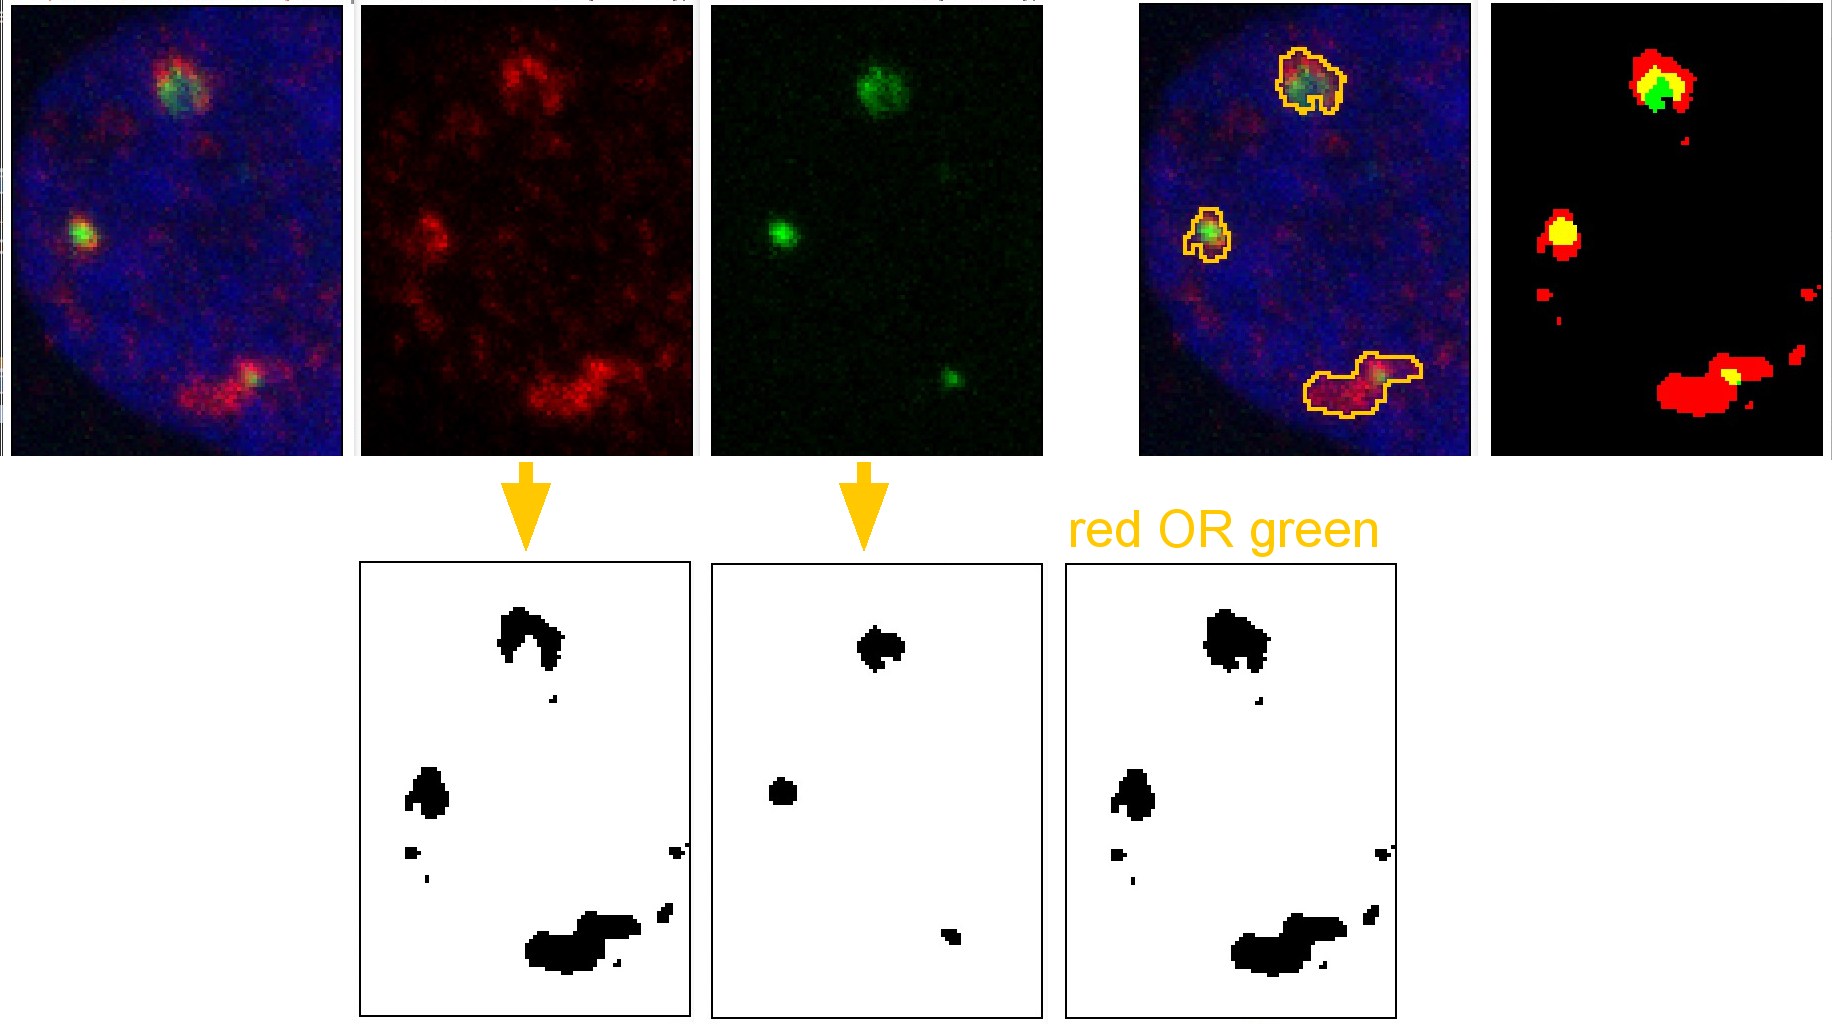
Step by step:
Red and green channels are each thresholded. Connected pixels are considered a single object.
The red and green channels are combined using the logical OR function.
This result is used to define the entire object.
The number of red and green pixels may be counted. In this example, the yellow pixels are most likely artefact due to limitations of spatial resolution so they do not represent molecules in the same 100 to 200 nm defined space. Also, there may be more because this is a Z series, not a single optical section, so overlap may be due to pixels (really voxels) above or below.
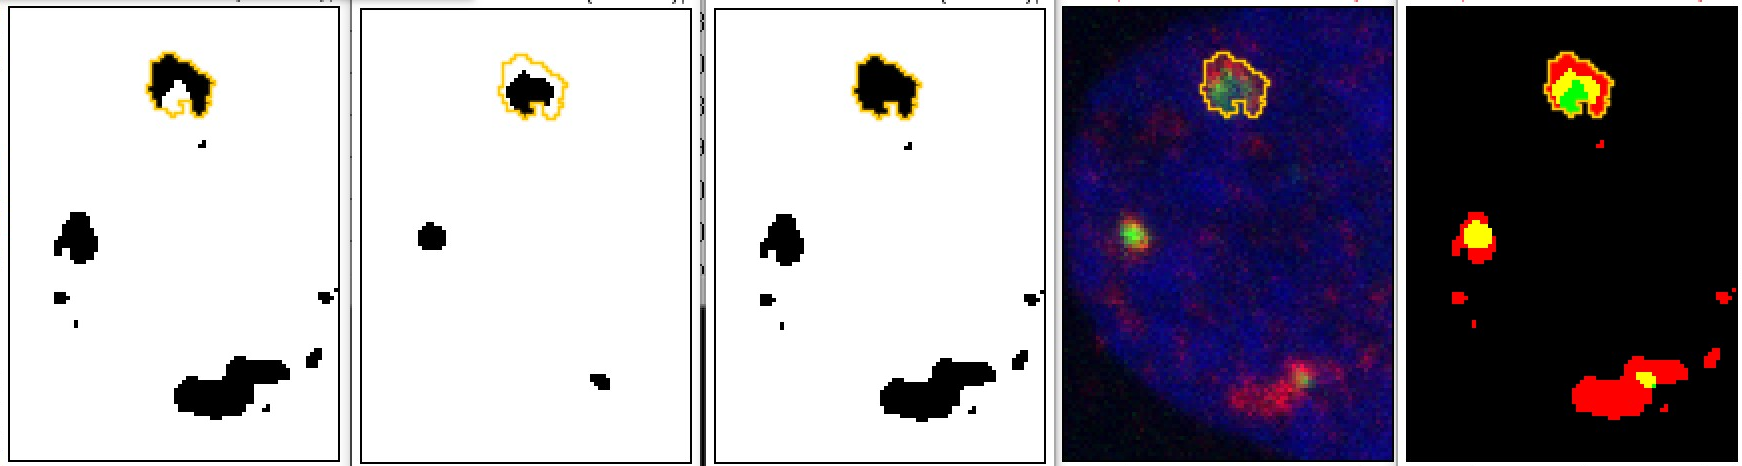
For numerical results the number of black pixels inside the orange outline is counted:
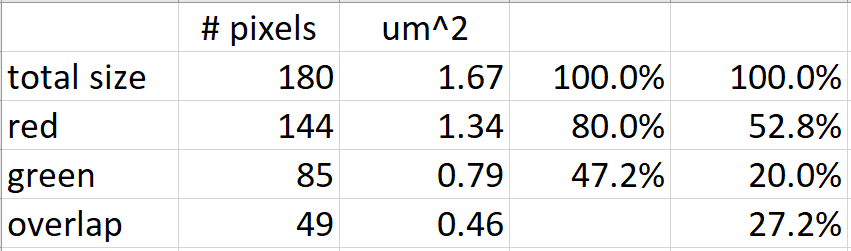
The first column of percentages ignores red-green overlap and the second column includes overlaps.
Perhaps the most difficult issue is defining valid thresholds, expecially when the intensity ranges for each protein may be different depending on biological condition.
The threshold for the long object at the bottom makes the object larger than it probably really is. Therefore, by eye the small green spot looks in apposition and not overlapping whereas after threshholding both the red and green areas appear larger and overlapped.