 annuli_macros_v207.txt fixes a bug in version 206 that
didn't do the background subtraction from the whole cell measurements reported in the
first line of results.
annuli_macros_v207.txt fixes a bug in version 206 that
didn't do the background subtraction from the whole cell measurements reported in the
first line of results.Updated 16 Dec 2004
annuli_macros_v207.txt fixes a bug in version 206 that
didn't do the background subtraction from the whole cell measurements reported in the
first line of results.
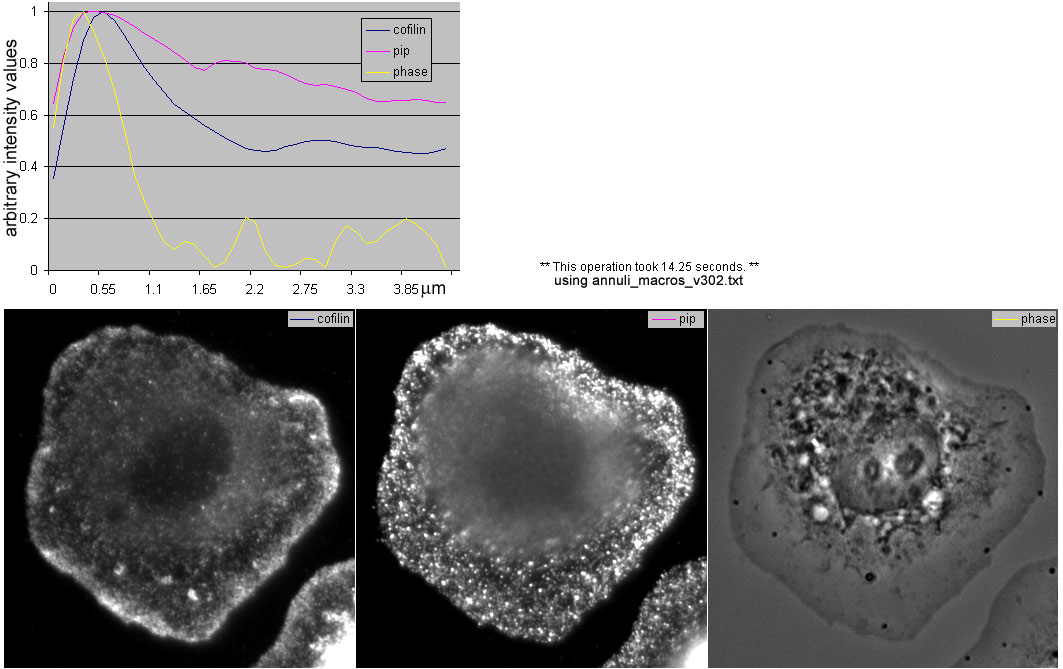
annuli_macros_v302.txt uses a different method than the series 2## macros and has slightly better spatial resolution at the first annulus (see picture at right), but yields essentially the same results.
annuli_macros_v302stadler was an attempt to do the batchmode command, but did not work. However, the last line of text in the logwindow noting the timing is removed which makes using Excel easier.
annuli_macros_v303.txt is a newer version that, unfortunately, I forgot to document.
These versions of the macros have been rewritten to be more flexible than previous versions.
What this version is missing is user friendly interface for putting multiple registered images into a stack and for using thresholding for tracing.
Also, an improvement I am working on for the next version is more precise control of tracing preservation after the automatic measurement of background.
Furthermore, a future version may include no automatic background insertion, but this is only if people tell me they have a need to analyze confluent cells.
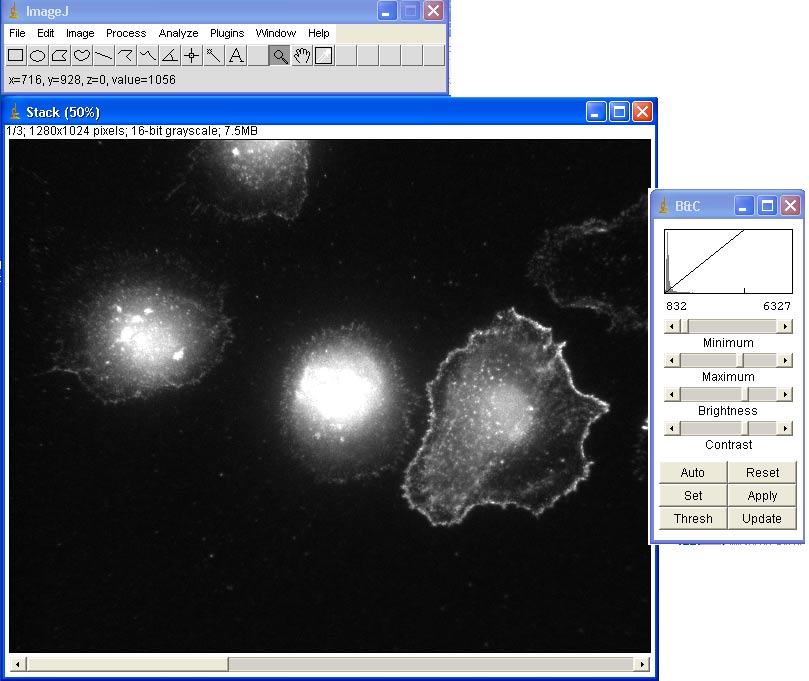
Examples screen snaps:
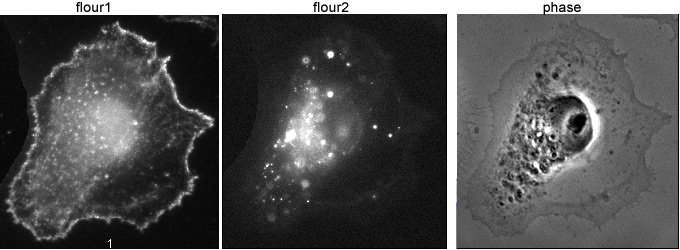
1. Just to make sure the system worked:
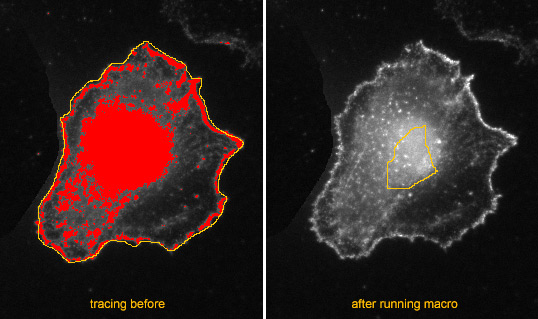
2. And real cells:
Modifying Regions of Interest a.k.a. Selections
Back in the days of NIH-Image is was simple to hold down the shift or alt/apple keys while tracing to add or remove from a region of interest.
ImageJ may include this in one of the 1.32 releases, but here is another method for tracing. This is a better method for a few reasons, one of them being that when you need to do slightly different analysis on the same cells, you don't have to retrace!
There are other ways of saving the traced selection that require less storage, but this method is good because you can see in the image which tracing goes with which cell.
Example results: click here.
Example results on multiple probes! Click here.
The version 3## series macros provides slightly sharper spatial resolution than the previous versions of the macros.
In the example below, the yellow peak is the dark edge of the phase contrast overlayed on the fluorescence images. Also, this normalization to 1 allows for ratioing of the probes at each location in future versions of the macros or manually in Excel.
Also note that this version of the macros reports how long it took to process the cells. The example shown here is on my home computer which is a Pentium 4 1.79 GHz with 512MB RAM. The cells were at full 1X1 resolution.
Here is a fun Excel spreadsheet to use as a template for your subsequent analyses. It could use some work, but does plot the results quickly.
LINKS:
1. Hand tracing is better than automation.