A flight will be counted based on a change of intensity in the image due to an aircraft being drawn in the region of the map. To measure this change, the baseline value must be known. This is defined by either choosing a timepoint where there are no aircraft visible, by producing a composite copy/paste map of no aircraft visible, or by creating a median projection through time based on the expectation that at no point will any location have aircraft present moe than 49% of the time.
In this example, one frame of a timelapse sequence (from 5:43 pm to 4:12 pm the next day) is displayed on the left and a blank map on the right. This will allow us to mark regions on the blank map, measure them, and compare them with directly with other regions.
![]()
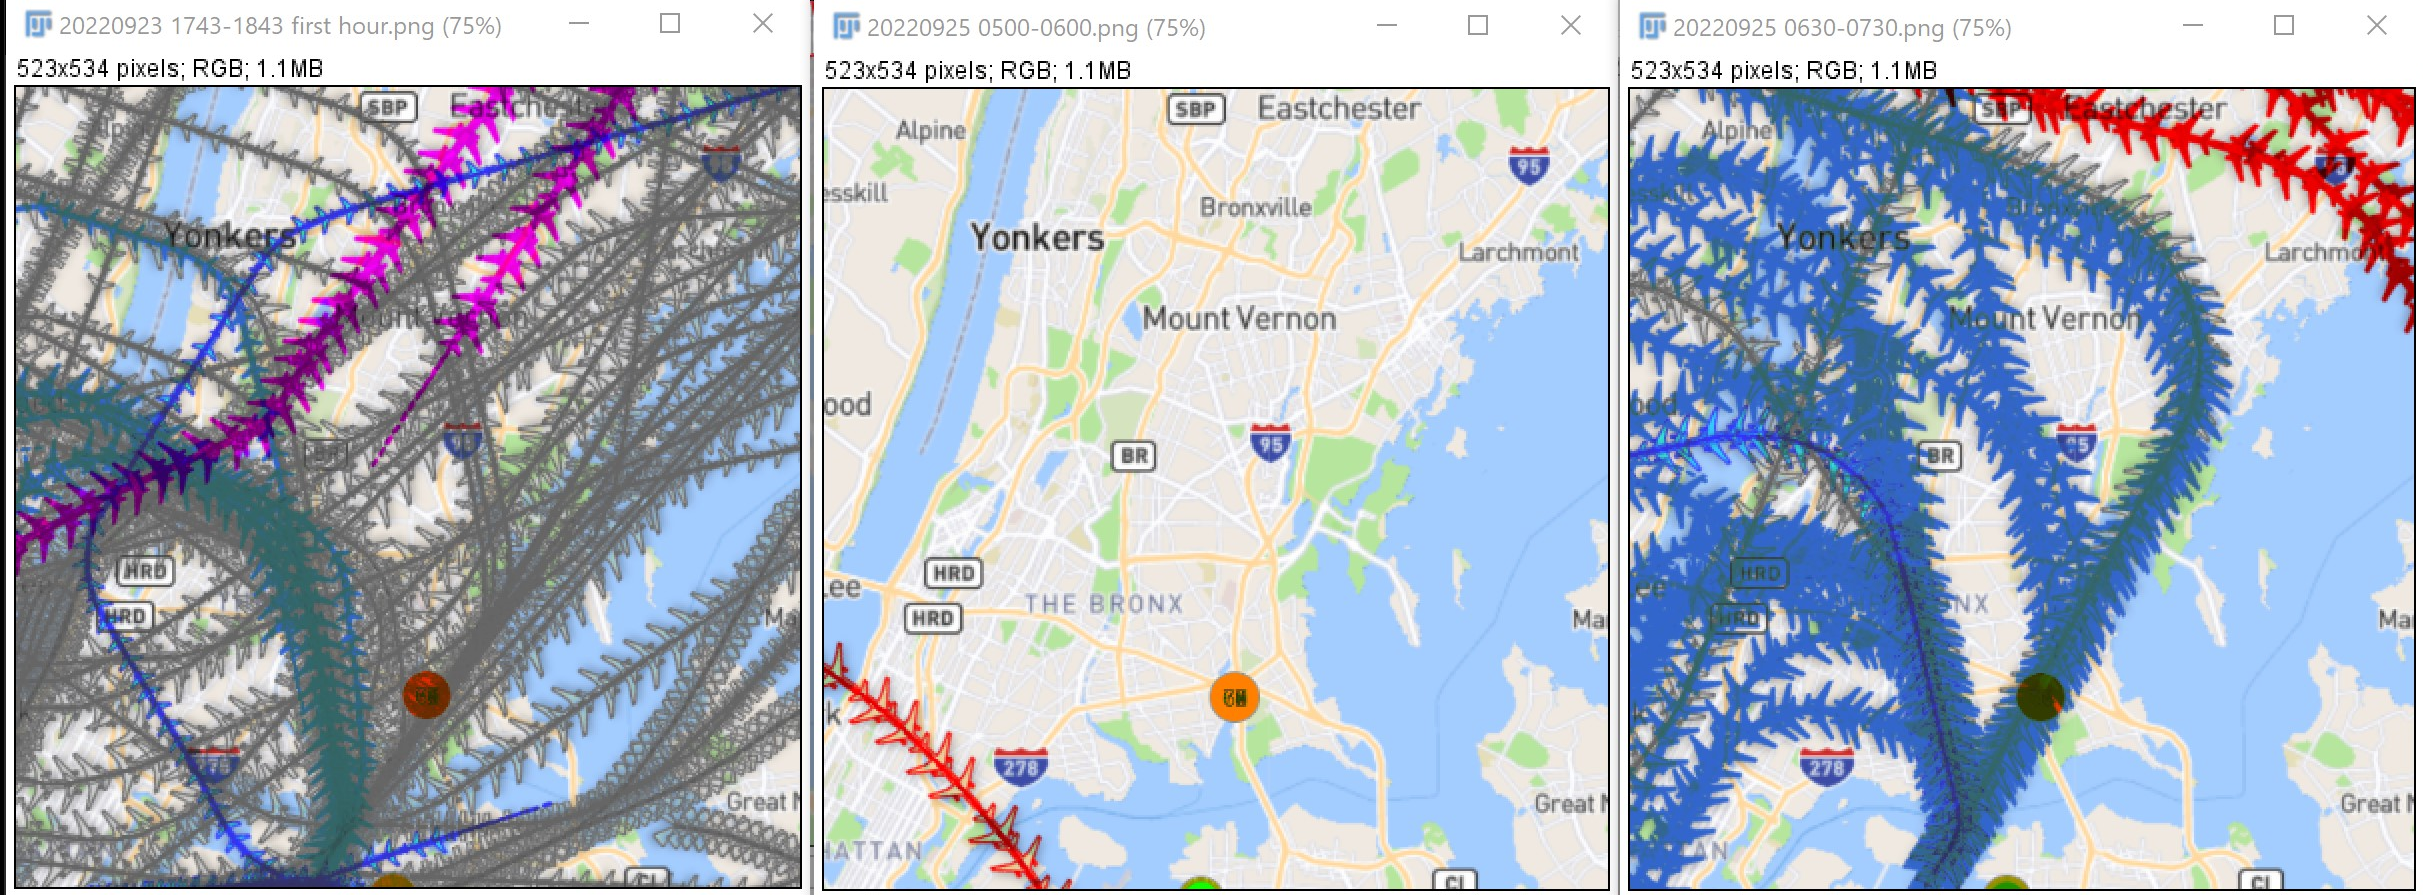
Before quantifying, let's look at another method to get a qualitative feel for number of flights and their location. The following three images are projections through time. Each one represents one hour.
At the left is the first hour of recording, late afternoon from 5:43 pm to 6:42 pm on Friday, September 23, 2022. The solid magenta are commercial flights departing from EWR and the other flights are not airport coded (gray). However, the paths that begin at the bottom and cut directly across the red dot and to the left of the red dot headed north are departures from LGA.
The center is one hour the next morning beginning at 5:00 AM. Only one commercial flight to arrive at JFK (color code red), so it is in descent.
The far right begins at 6:30 AM and shows departures from LGA (blue) and from JFK (red). Note the the LGA departures need to turn west rapidly to avoid JFK traffic. Given the high density of flights in a brief time, it appears there is little room to modify LGA flightpaths to turn later.
It is difficult to count number of flights using this projection method to visualize, but we can begin to make judgments based on these data. For instance, the picture below has the Glenwood Lake (GL) neighborhood outlined in red. It is reasonable to conclude that in the afternoon, GL received a fair number of flights as flights were distributed across lower Westchester.
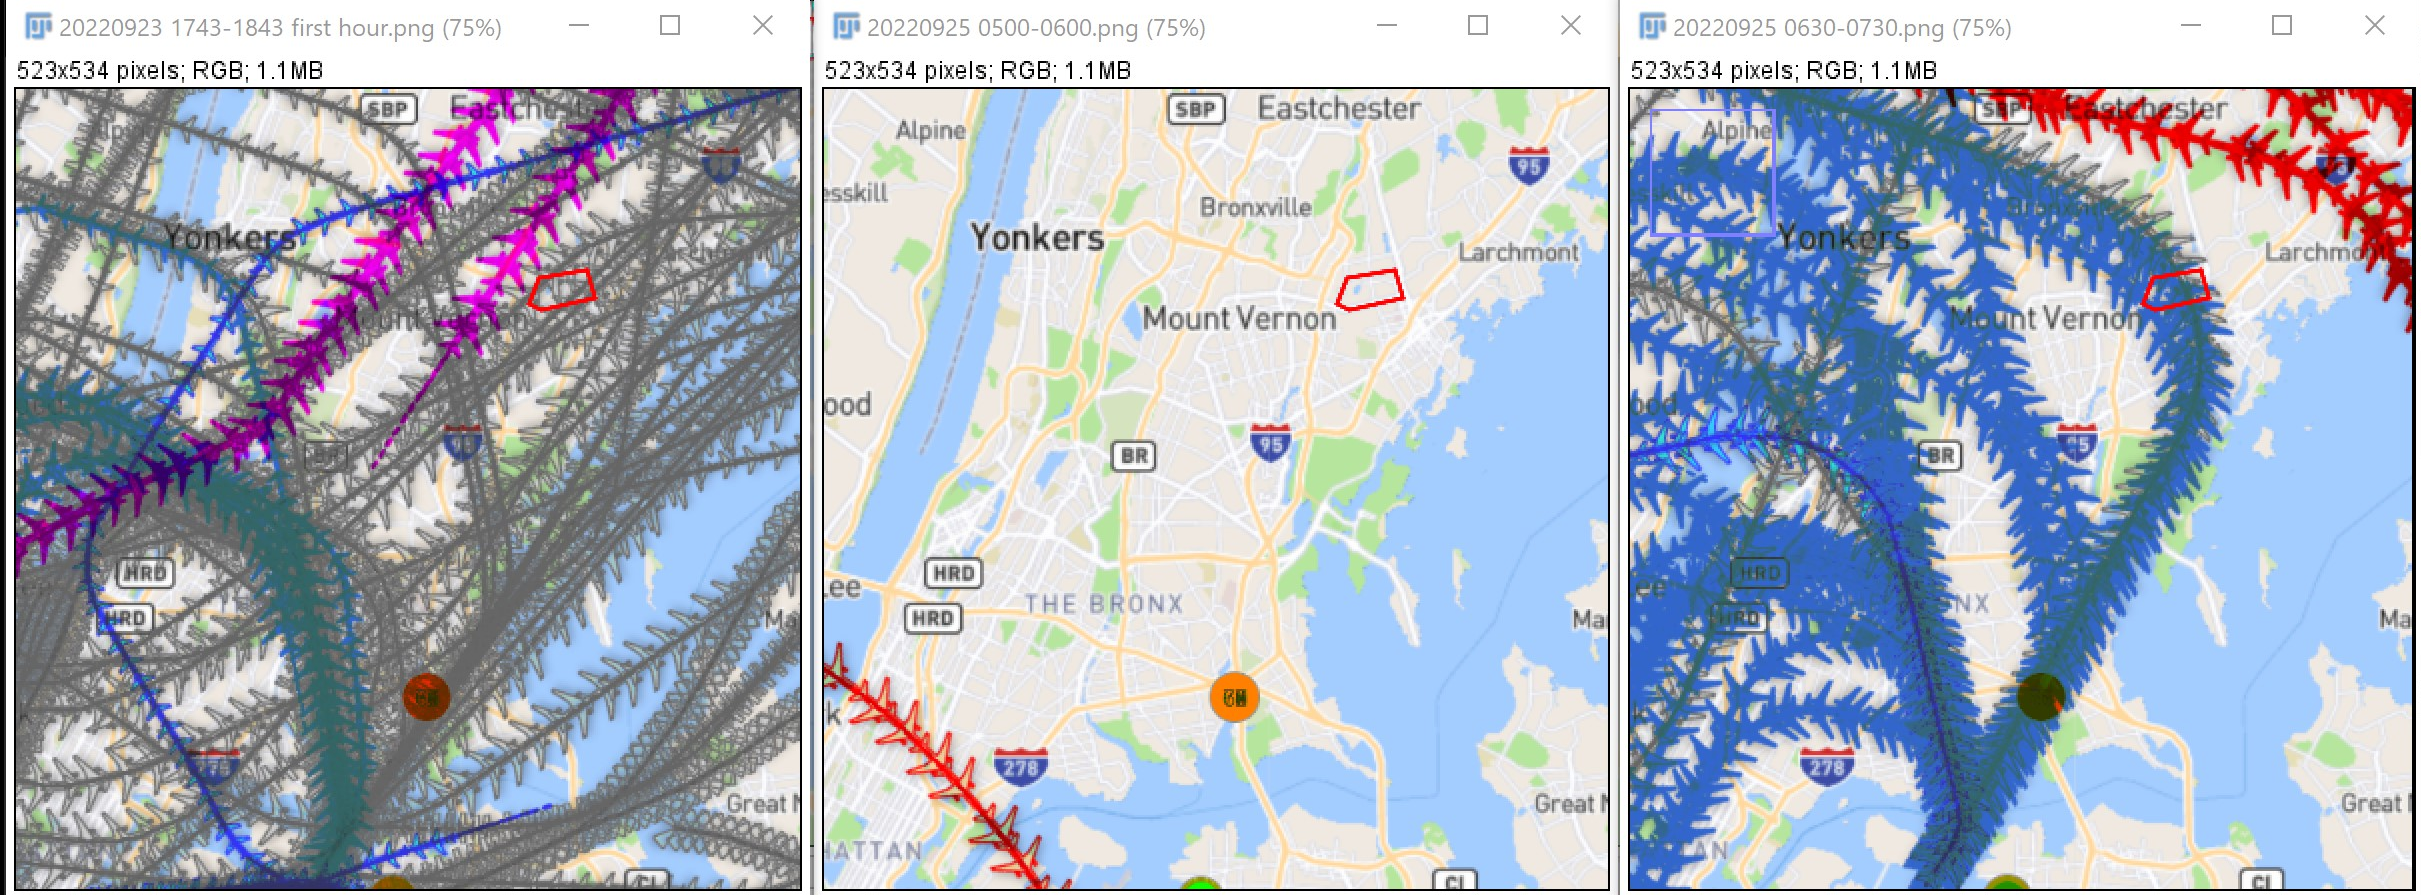
This is an example of one way of visualizing the data. Although many things are constant, such as locations of airports, before making generalizations of trends based on these data, consider that this is one day. Different days may have different scheduling.
Let's take a step towards counting.
6:30 to 7:30 am on 24 Sept 2022.
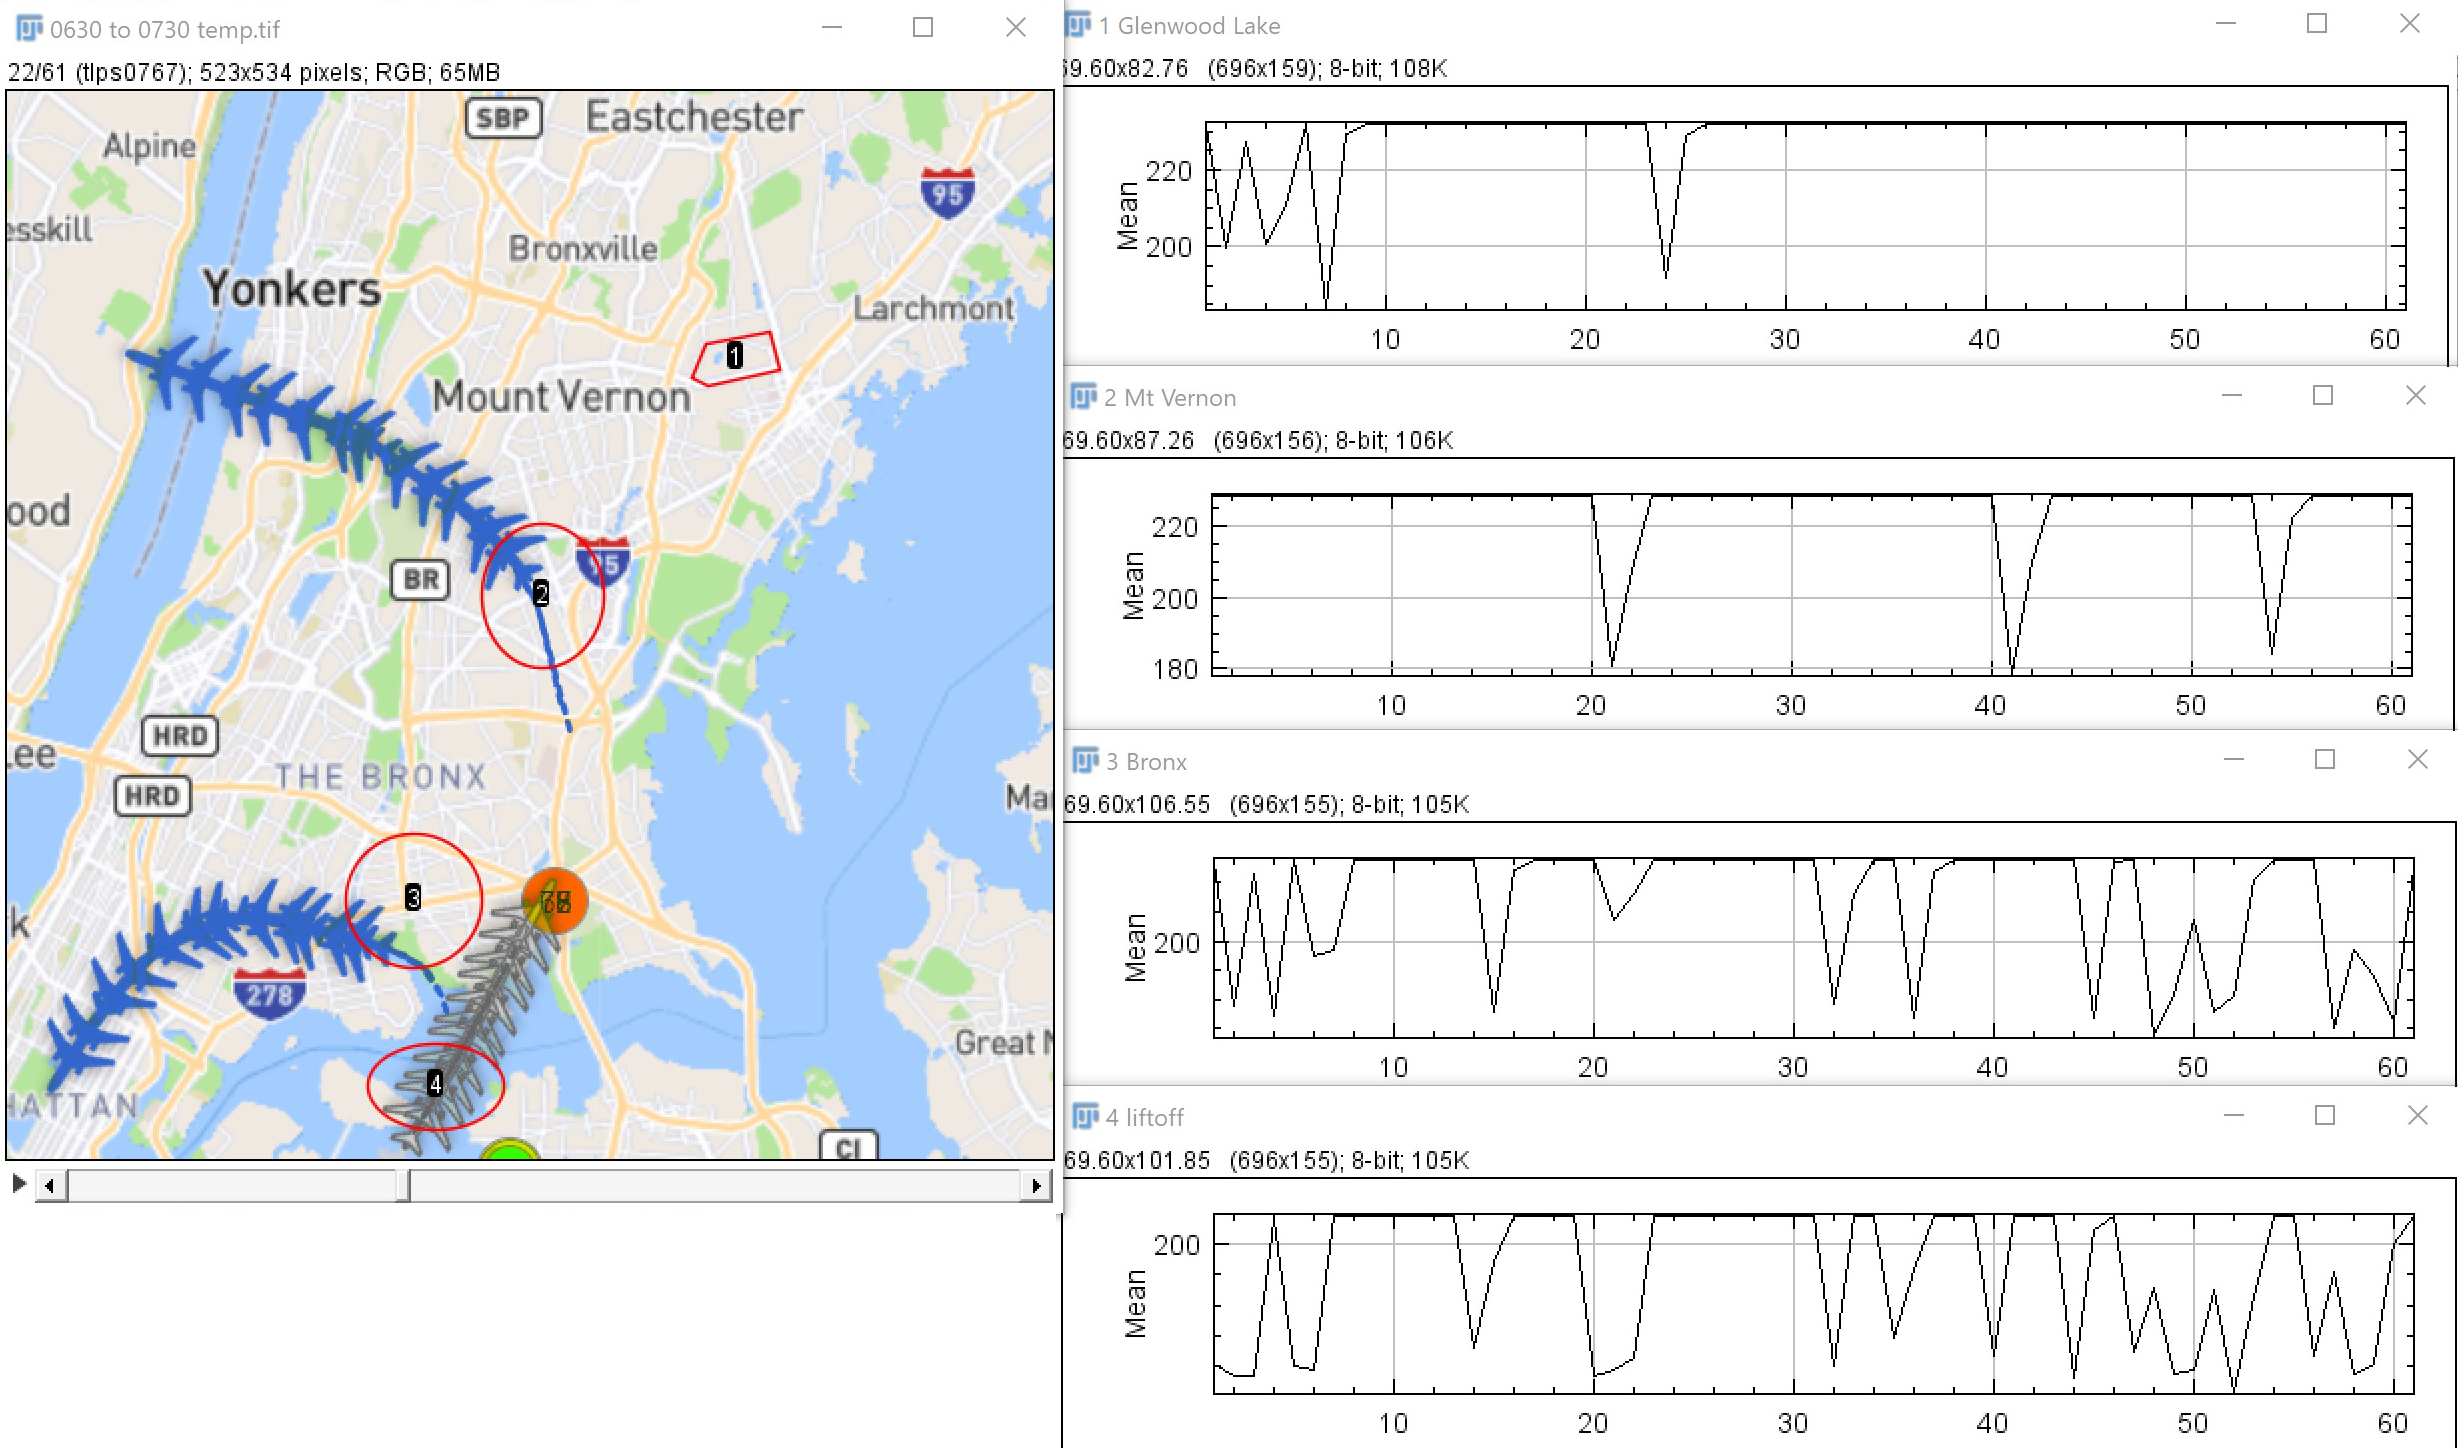
6:51 AM is displayed at the left in a movie of one frame per minute that ranges from 6:30 to 7:30 AM. This is timepoint 22 in the graphs. Dips in the graph are clearly visible in Mt. Vernon, the Bronx, and the end of LGA runway which each have a plane aloft simultaneously. The top Glenwood Lake graph shows that two minutes later a plane crosses through. This is the plane (shown in gray) taking off from LGA.
Reasonable conclusions: It appears Mt. Vernon and Glenwood Lake get equal direct flyovers. The Bronx gets far more than both northern locations combined. Obviously, the end of the LGA runway gets the most as all flights originated there.
These kymograms of the same regions tell the same story as the graphs.

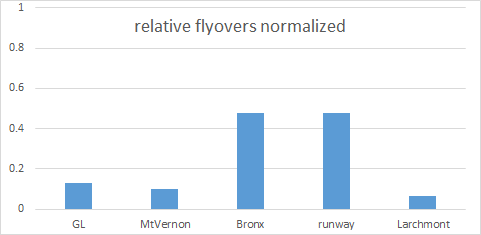
For our method of counting, any variation below baseline intensity (the map is always represented with brighter pixels than flights) will be counted as aircraft in the region. Therefore, this may not be a completely accurate count of number of planes. However, when normalized to the total number of frames in each period being measured, this will provide a direct comparisons with other locations being measured. For instance, no planes would be zero. Planes all the time would be 1.
For this period of time, the results are:
This is now a tool that can be used for any regions for any time period. [ImageJ code]
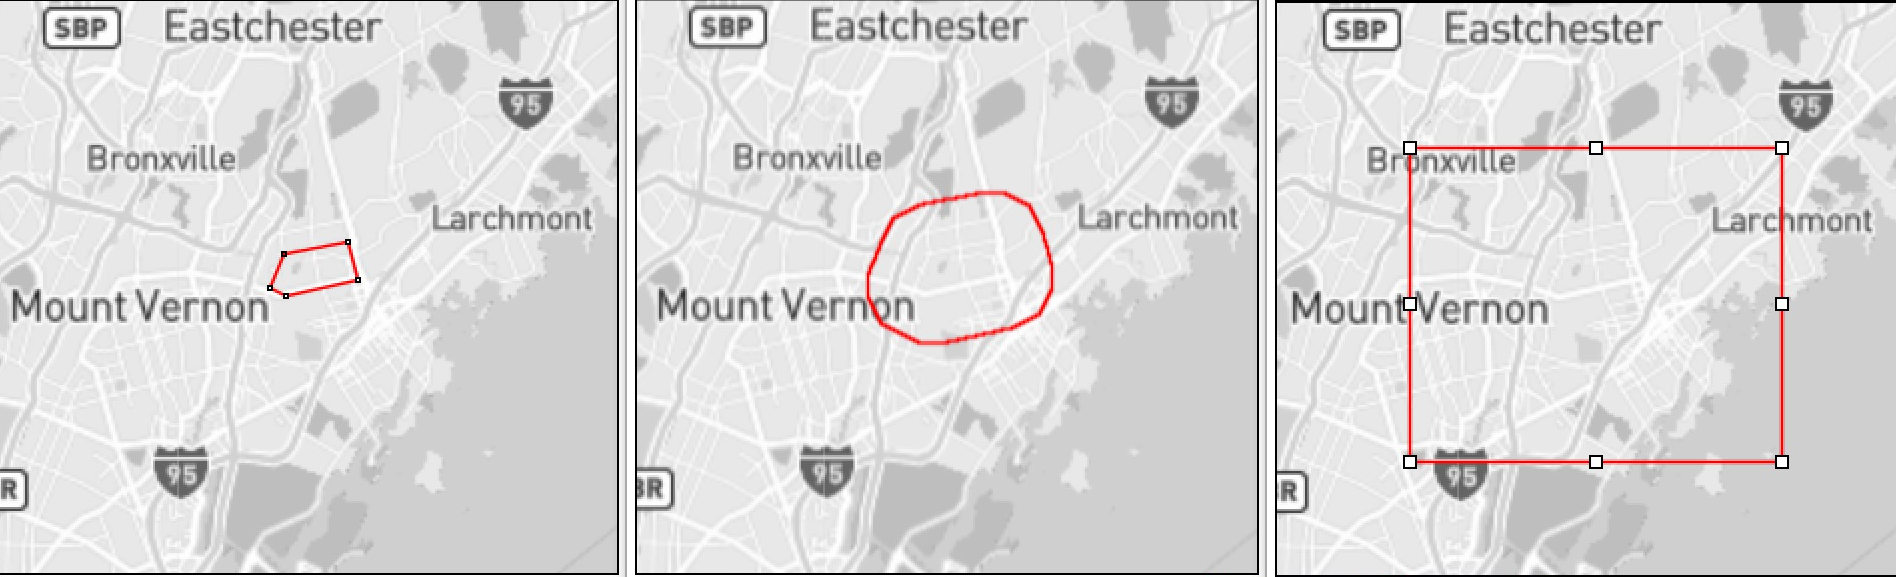
I ran the analysis tool on GL area and 2 flights were reported. This was difficult to believe, so I looked at the images.
The 2 flyovers (outbound from JFK) were just after 15:00. They are the rightmost red lines. One flies directly over the lake and one clips the SW corner of the neighborhood.
It seemed unlikely that there were no flights all afternoon.
When sampling in the areas pictured below from 15:00 to 18:00, numbers of flights were measured as 2, 5, and 26.
So I confirmed using the real-time flight data from another website. The results showed something I suspected but wasn't sure of, that the webtrak-emsbk feed was pausing. Based on repeated visual and sound confirmations, it is accurate when it is running, but there are blocks of time when the browser script does not display data properly. The airnav site, on the other hand, is both realtime and reliable for data from the LGA radar source.

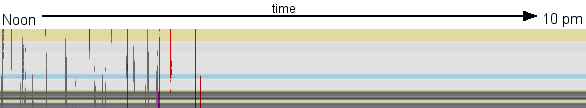
The kymogram on the top shows frequency of flights over a 24 hour period, midnight to midnight, on Sept 24.
The kymogram on the bottom shows midnight to 8:51 pm on Sept 25 (our server connection went down when a thunderstorm began).
Another way of viewing the same data.
