| Author: | Michael Cammer michael.cammer@med.nyu.edu |
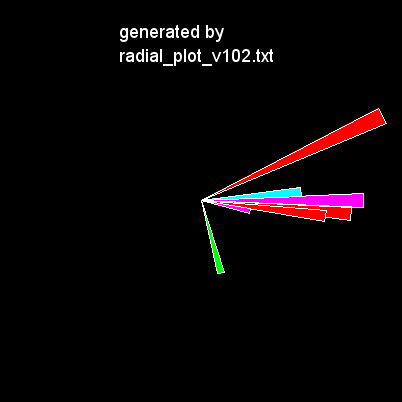
| History: | 20150706 radial_plot_v102.txt see explanation below. |
| Source: | (see below) |
| Installation: |
It's just a macro. Plugins > Macros > Install... |
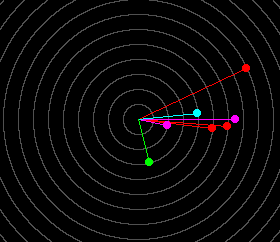
| Description: | Draws radial profile plots as angle, distance, and time. Angle is from center of graph. Distance is in length of line. Time is color coded. radial_plot_v102.txt is the first version. The angles, distances, and times are typed in directly into arrays. Later versions of the macro will get these arguments from text files or from analyses done in the same set of macros. radial_plot_v103.txt reverts to simple lines with balls at the end such as http://www.cyber-wit.com/onlineHelp/PolarBar.htm
|
| See Also: | http://stackoverflow.com/questions/11250166/matlab-rose-plot-increasing-radial-increments |