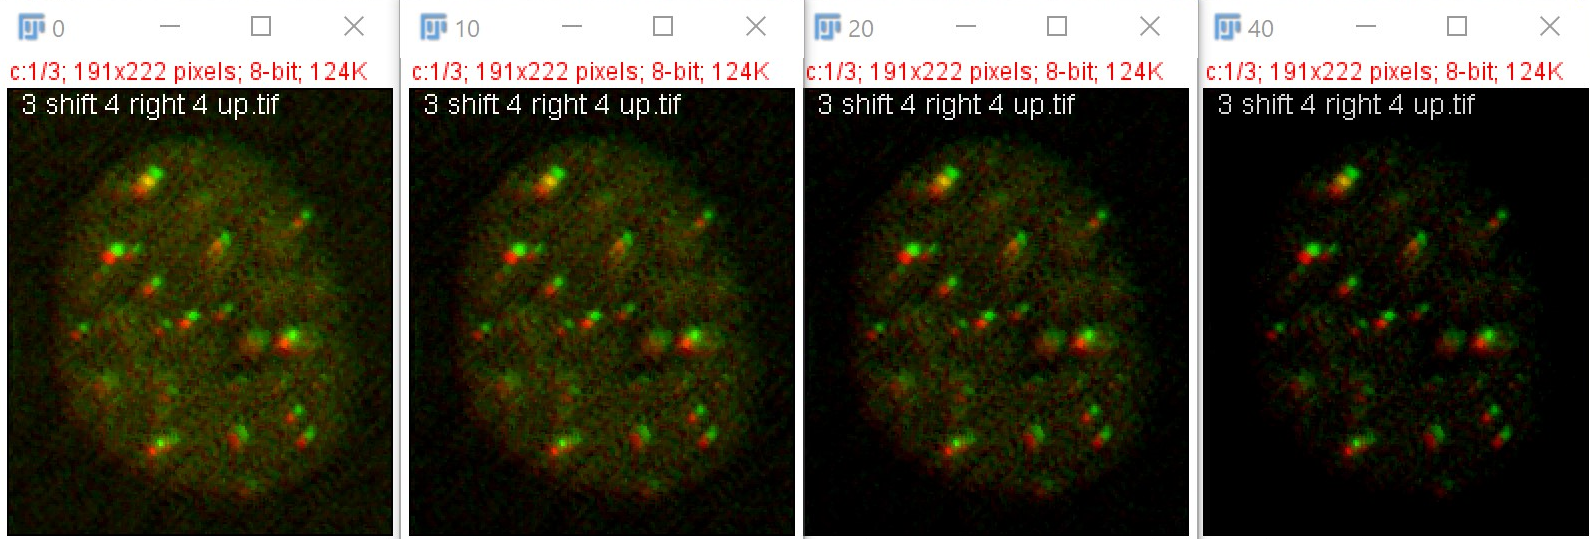
Threshold makes a big difference.
Same images above analyzed with three different thresholds which reduces colocalization by eliminating diffuse background labeling.
Colums report threshold, number pixels measured, and correlation.
| threshold 10 | threshold 20 | threshold 40 |
| 1 10 30402 1 2 10 29047 0.7832 3 10 28795 0.5914 4 10 28674 0.4741 5 10 29254 0.3343 |
1 20 24791 1 2 20 22469 0.7278 3 20 21801 0.4689 4 20 21748 0.3201 t5 20 22345 0.1387 |
1 40 14403 1 2 40 11265 0.7254 3 40 10372 0.426 4 40 10188 0.2639 5 40 9857 0.01757 |
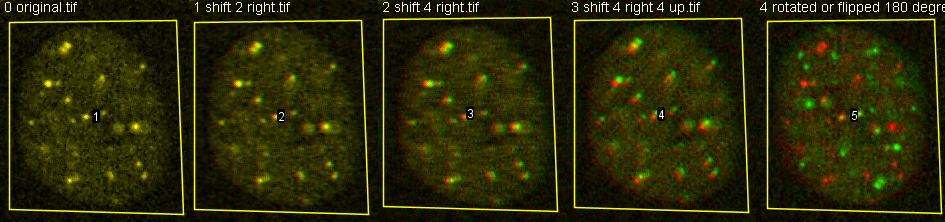
Images pictured at progressive thresholds:
Macros used for these results and image data used.
Note how a dramatic threshold, which preserves only the brightest structures, changes the results dramatically as the image shifts out of register. A shift of 2 pixels results in 50% correlation, not 73% to 78%.
The threshold is really 90, not 40, because 50 was subtracted from the image and was used in the analsys for a total of 90.
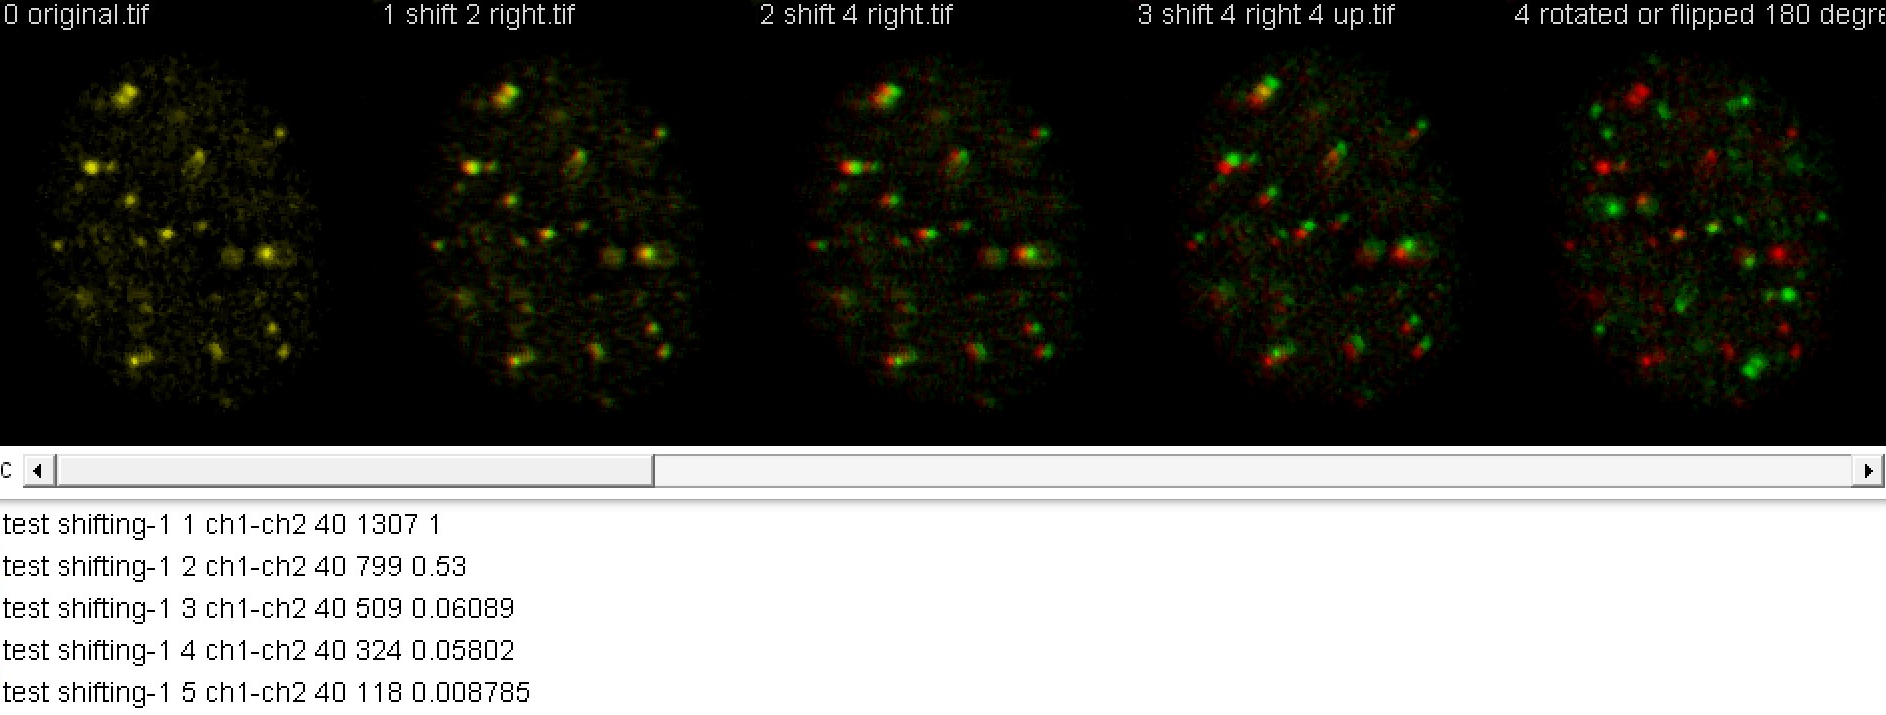
Therefore, if interested in reporting colocalization of the brightest structures, an aggressive threshold is preferred.