Nikon TIRF
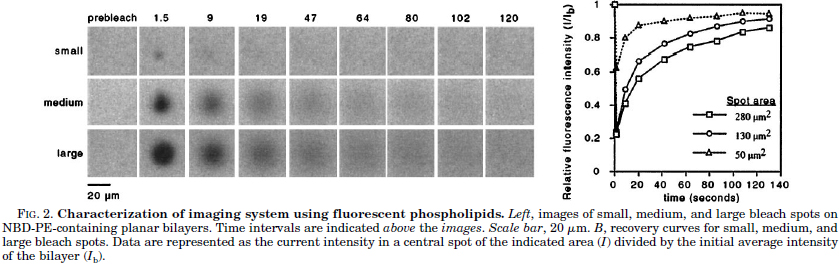
Goal: a quick assay to estimate mobility of proteins in lipid bilayers or bilayers themselves to be used immediately in experiments. This method takes less than 10 minutes to assess the rate of flow of a fluorescently tagged protein in a bilayer. Manually opening and closing the field diaphragm during automated image acquisition approximates the "medium" and "large" bleach spots from Dustin JBC 1997. Examples here are single probe but this method may be used to look simultaneously at multiple labels.
This was done with Alexa 488 ICAM, not fluorescent lipids, because this protocol is meant as an example of testing a bilayer that will subsequently be used for a real experiment with cells added. Therefore, the percent recovery was expected to be less than with pure lipids as published.
All results below were collected at 10 second time intervals at 512 X 512 pixels.
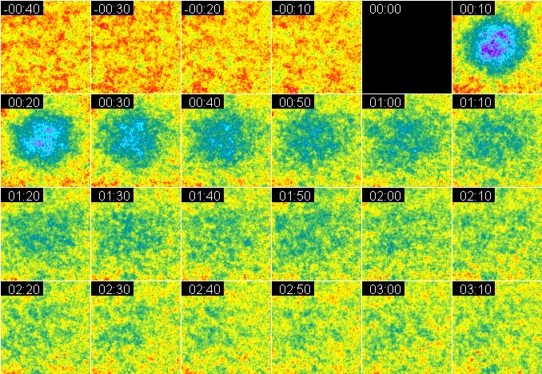
The user hit the run button on the computer. A bilayer was imaged for two timepoints at low laser intensity. The user closed the field diaphragm and clicked the continue button on the computer. The spot was blasted with the maximum laser light for 10 or 4 seconds. As soon as the user saw the laser shut off, he opened the field diaphragm because 10 seconds after the light shut off, the first of the recovery images was collected. (Depending on the user's skill at action computer games, this may be done consistently down to a second for finer timing.)
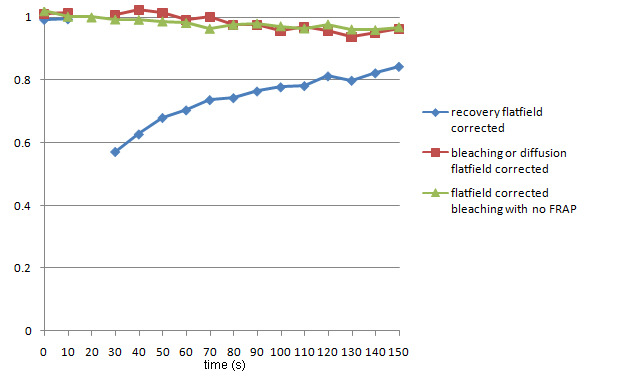
Before analysis, the entire timecourse was flat field corrected. The first timepoint was Gaussian blurred with a 32 pixel radius and the entire sequence was divided by this (hence the initial values slightly greater than 1). (For on-the-fly analysis, inpection of the raw data is sufficient to decide whether the bilayers are good for the experiment. This is the primary reason for this method, to practically check the quality of each bilayer in an ongoing experiment.)
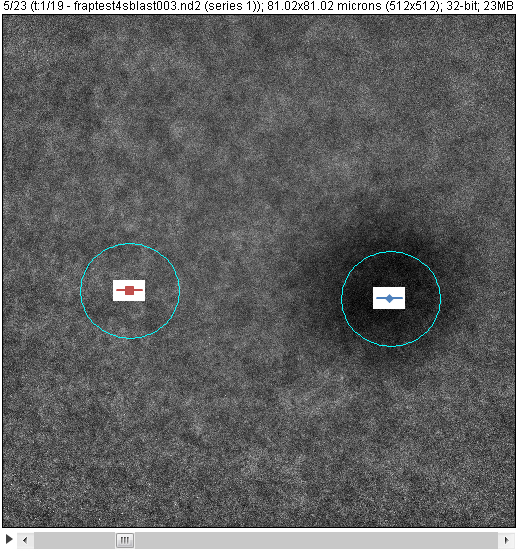
Spots were drawn and intensity measured throughout the timecourse. The markings in the spots correspond to the graphs below.
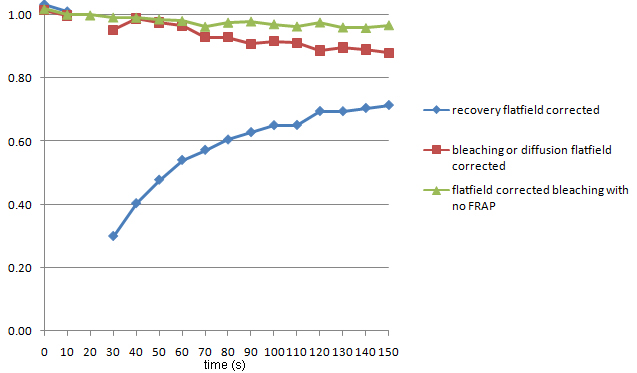
This sequence was bleached for 10 seconds. The spot outside the bleached area drops because bleached molecules move into this area as unbleached ones move into the bleached area. The green line is from a separate run of the experiment where there was no FRAP. This shows the amount of bleaching from imaging the entire field. (It is possible to compensate for this bleaching by repeating a few times and fitting to a curve to be applied as a correction factor.) (Excel 2010 format spreadsheet)
The following example was bleached for 4 seconds. Less bleaching, therefore greater recovery, and less drop in intensity outside the bleached area.
content last updated 20110318 - links last updated 20190326
Imaging on this page by M Cammer & D Depoil; comments, questions, suggestions: Michael.Cammer@med.nyu.edu