Membrane potential method.
Labeled cells were imaged with the Zeiss 710 with line-by-line sequential mode to eliminate green spilling into red channel. Images were then ratioed in ImageJ using a custom macro.
The first part of the macro separates the channels, median 1x1 filters, sets a threshhold for the background, does the ratio. The next steps are optional masking to limit the results to the structures of interest. The two original channels are linear contrast stretched and maximum pixel combined, rolling ball background subtracted, thresholded, and applied to the ratio data as a mask.
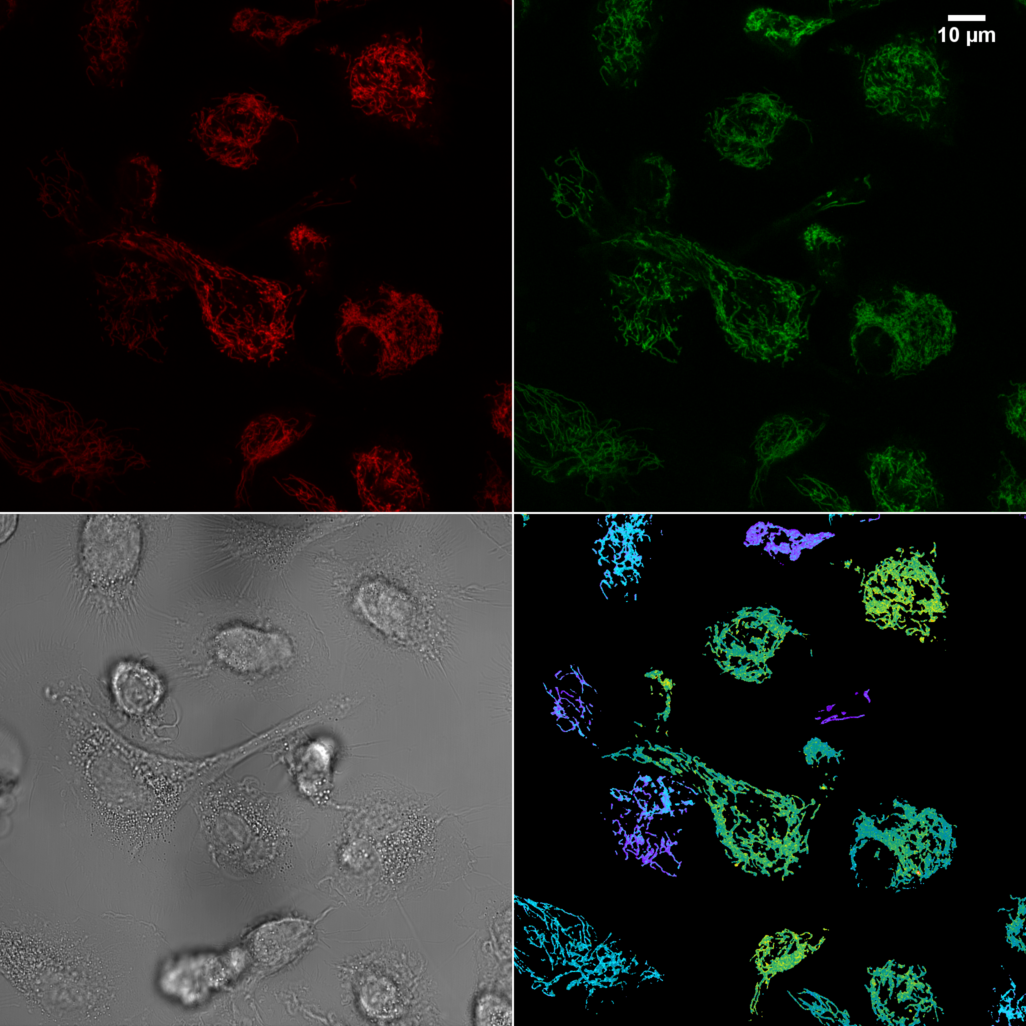
The following image shows the raw data with the ratio shown at 50% original spatial scale.
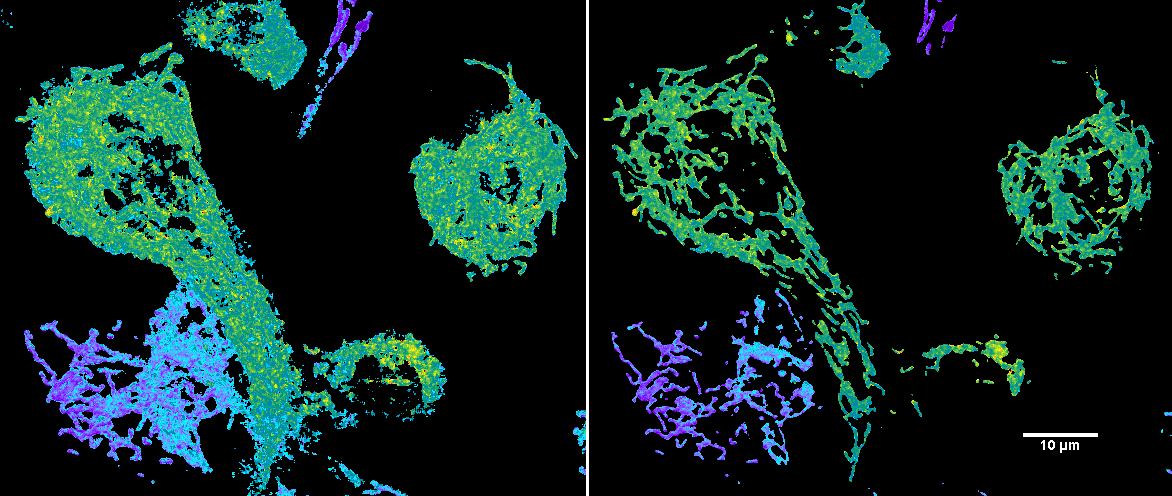
The following image shown at orginal 1:1 spatail scale illustrates the ratio before and after masking was applied to delineate the mitochondria structure.
For example measurements of what the colors mean numerically, please see previous webpage.
Red label reports the change in membrane potential and green is stable. Results are red divided by green. This assumes red and green load into mitochndria at the same rate, otherwise the ratio reports variation of loading. Therefore, JC1 also looks like a more useful label.