1. Good image. Full range 0 to 255, no clipping at 0 or at 255.
2. Left: region above without blue.
Right: negative offset clipped at 0 and some saturation
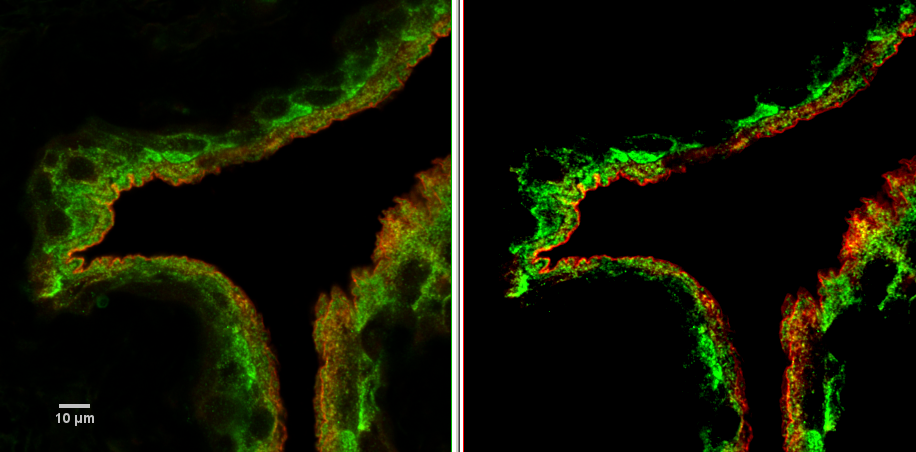
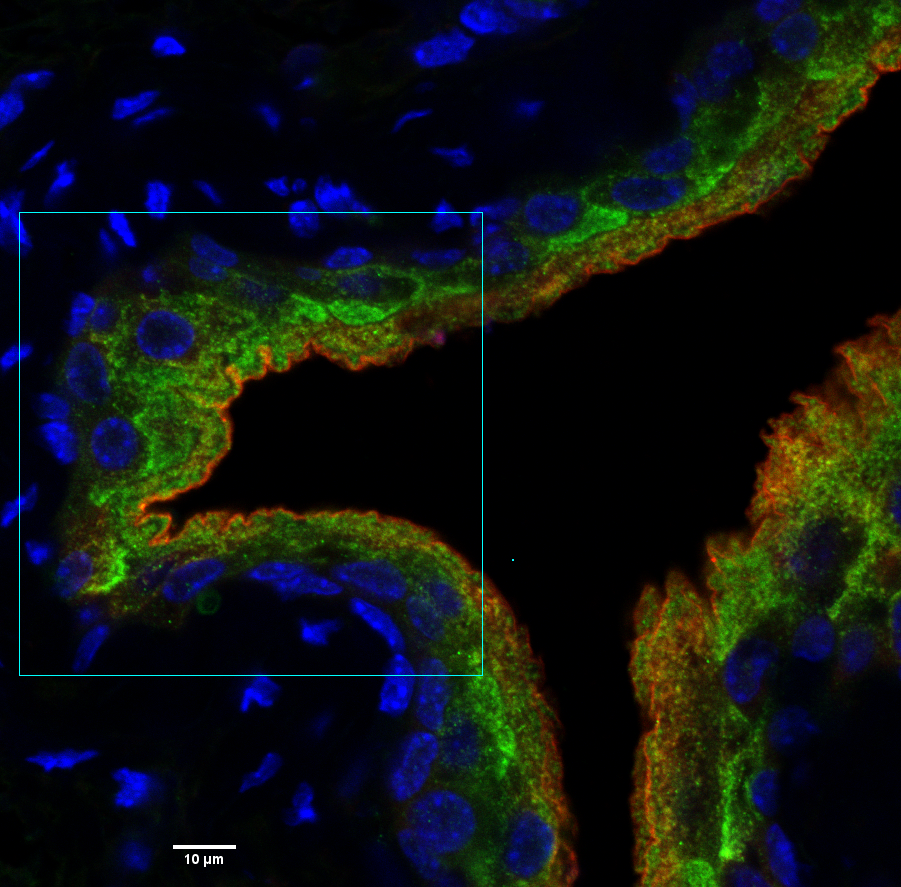
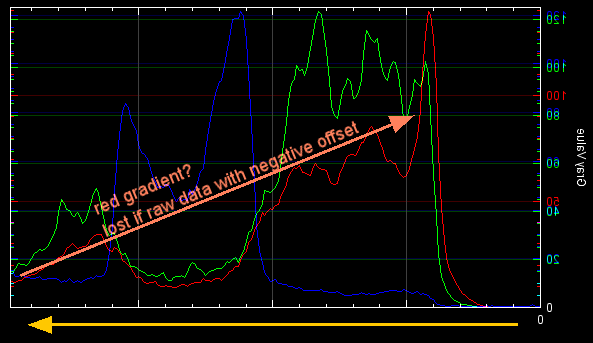
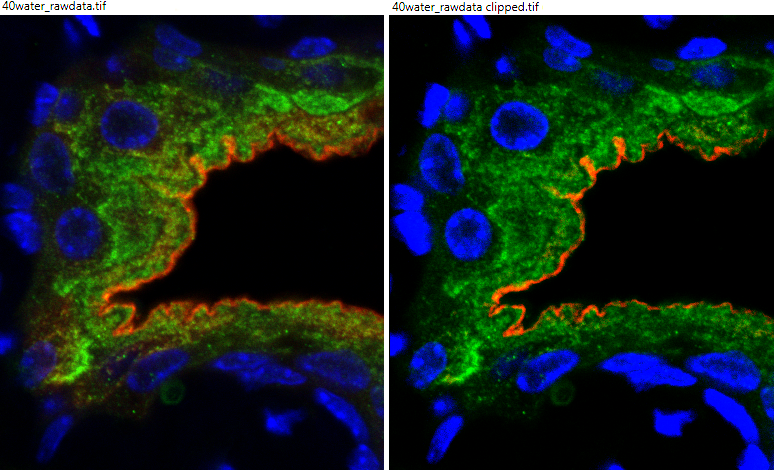
4. Example of how clipped data change quantification of protein distribution and biological interpretations.
Left: Offset at 0 and no saturated intensities.
Right: Offset at -43 as found in a confocal method and a few saturated intensities.
Not familiar with this particular project, the biology below may miss the mark, but this is an illustration of how we can think about information in images and how we observe phenomena as depicted in images.
Quantification of the raw data (left) may lead to knowledge of the presence of, or more subtlely a gradient of, protein expression from cells more basal to the apical layer or even discovery of a pool of protein in the top cell layer, distinct from the high concentration in the membrane.
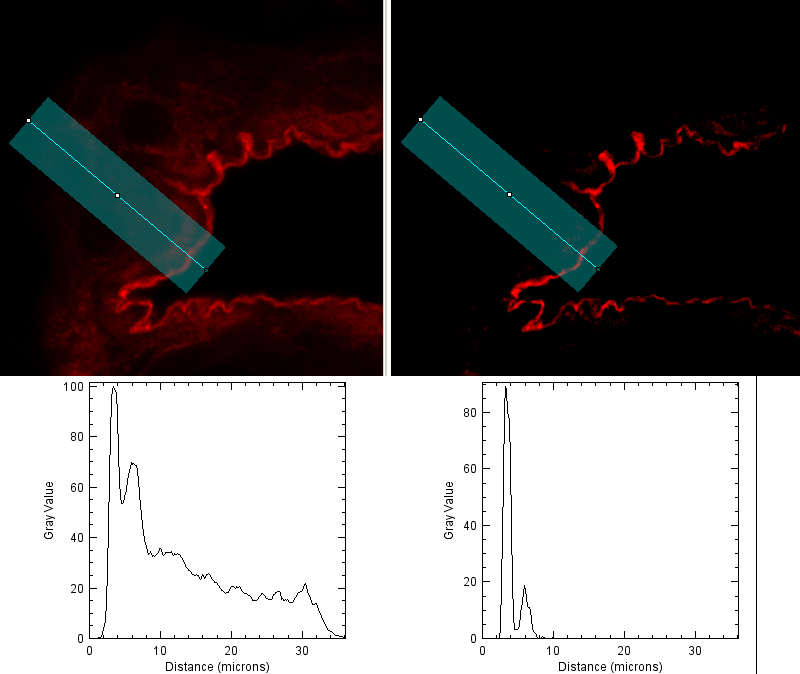
Excluding values from the raw data (right) by a negative offset excludes information. Described better in the next set of pictures showing intensity profile plots of each channel along the orange arrows.
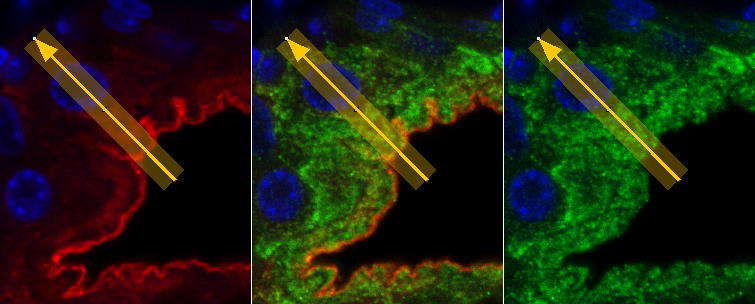
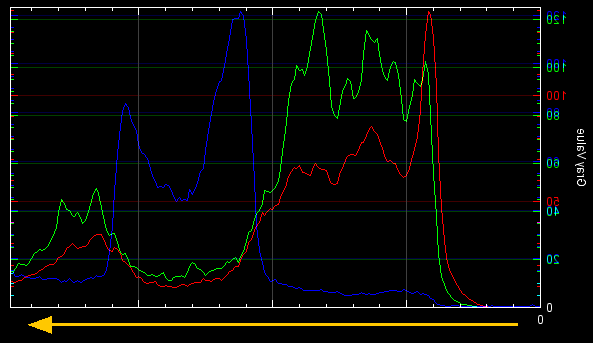
These plots would not be possible without the offset correctly set at 0 during data collection.
These plots may be automated in all channels.
(Are corresponding gradients of morphology in ultrastructure also visible in TEM?)
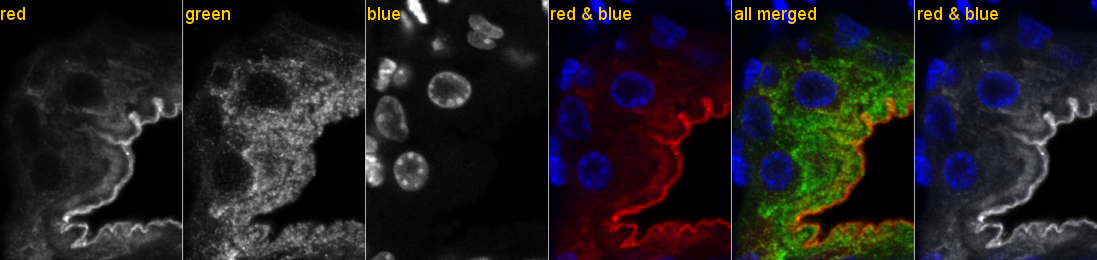
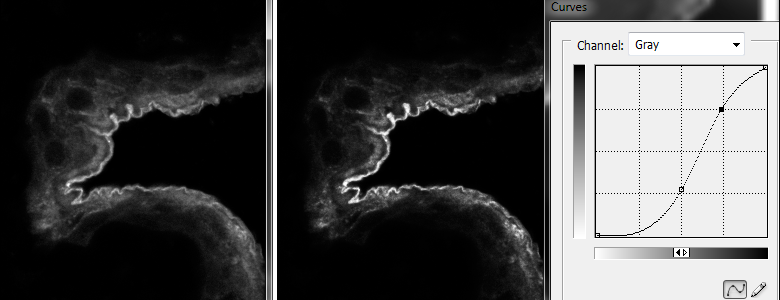
Displaying data is a different issue. Here are the raw data displayed as grayscale with three merge options. I argue for grayscale because it is higher contrast and avoids problems with colorblind people. There is a lot of resistance to doing this and it does not change the science, but I like to recommend it.
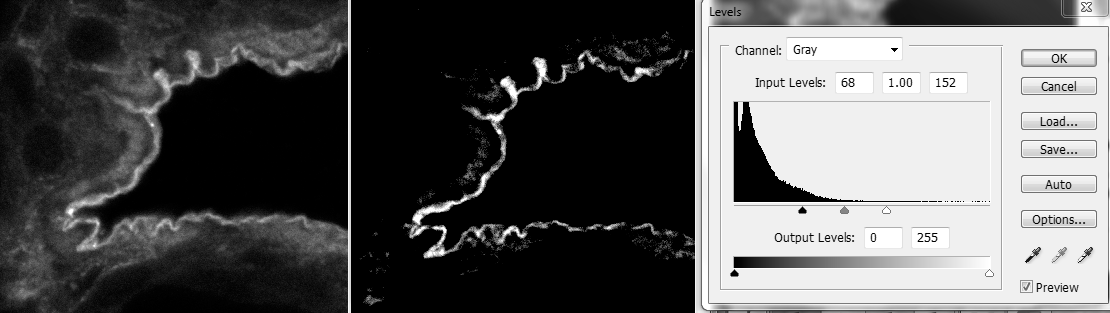
Photoshop
Display may involve linear or non-linear adjustments (which may be documented, see end of this page) to illustrate specific points and should be applied equally to all experimental conditions.
Adjusting the lower level to 68 is the same as adjusting the offset to a negative number (such as -43 or -68) when collecting raw data.
This exact same adjustment can be done in ImageJ when in composite mode using the top two sliders (maximum and minimum) in the Image > Adjust > Brightness/Contrast window.
and
Regarding documentation, here is a general rule to follow. Many journals also have instructions to authors.
From Rossner & Yamada, 2004, http://jcb.rupress.org/content/166/1/11
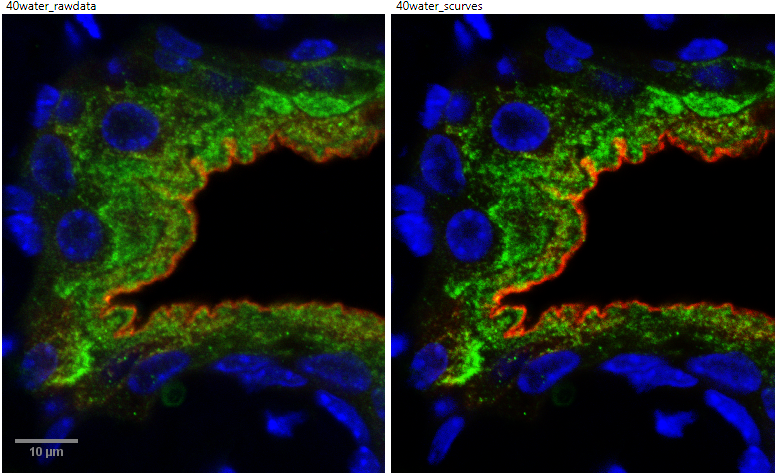
"Adjustments of 'Curves' or 'Levels' in Photoshop alter the tonal range and color balance of an image by adjusting the brightness of only those pixels at particular intensities and colors. Such nonlinear changes are sometimes required to reveal important features of an image; however, the fact that they have been used should be disclosed in the figure legend."
Here's something I might write:
Raw data used for quantification contained full linear range. Contrast applied equally to all experimental conditions in figure to clearly delineate enrichment at apical surface.