20250830
For years I've been bothered by quantification of TEM (Transmission Electron Microscopy) images of mitochondria because they 1. inaccurately count the number, 2. underestimate the size, especially length, and 3. miss branches and larger scale morphologies. Lower magnification light microscopy of mitochondria in intact cells, even in the flattest spread mammalian cells, show huge variations of morphologies, but isolated 70 nm slices, especially in pellets, definitely lead to gross mismeasurement. For instance, in LM, we often see mitochondria which are longer than an entire field of view in TEM, yet do we ever see a mitochondrion which traverses a full TEM field? (Perhaps pelleting confounds this.) With so many unknowns, there are no correction factors for stereology. Serial EM could address this, but this is a lot more work and not how I've seen the quantification being done. (Perhaps we need to start using STED or SIM for our mitochondria morphology measurements at this scale.) I am curious if anyone could point me towards references which discuss this.
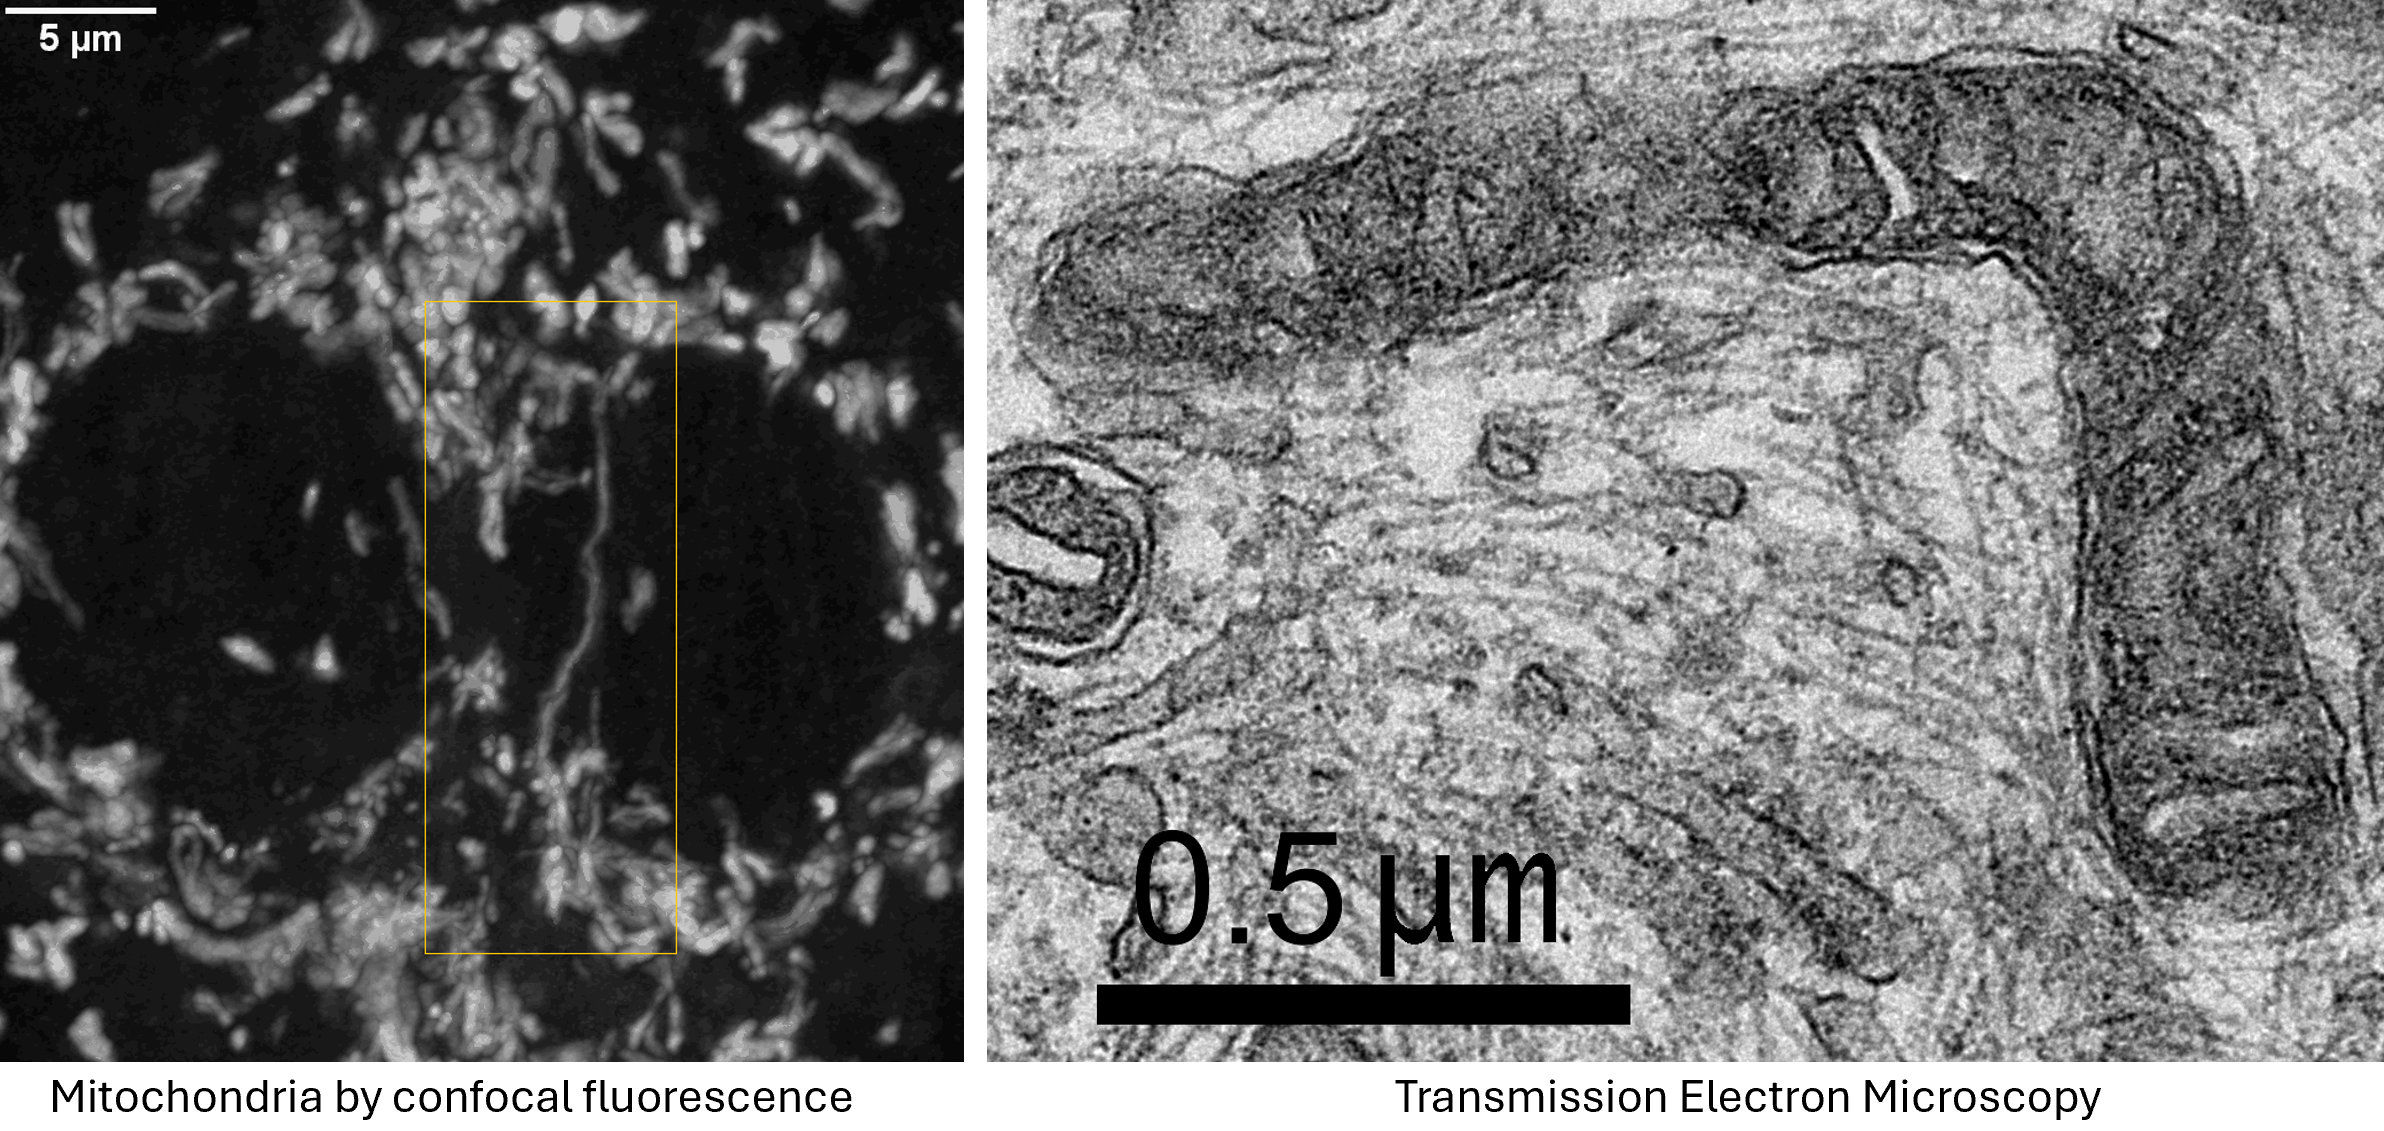
Example of long mitochondria with branches.
TEMs of these cells result in short mitochondria (green) which never show these extensive lengths and apparent branching.
Why? The fluorescence image represents a few um thick section from directy above mammalian cells spread on a coverslip.
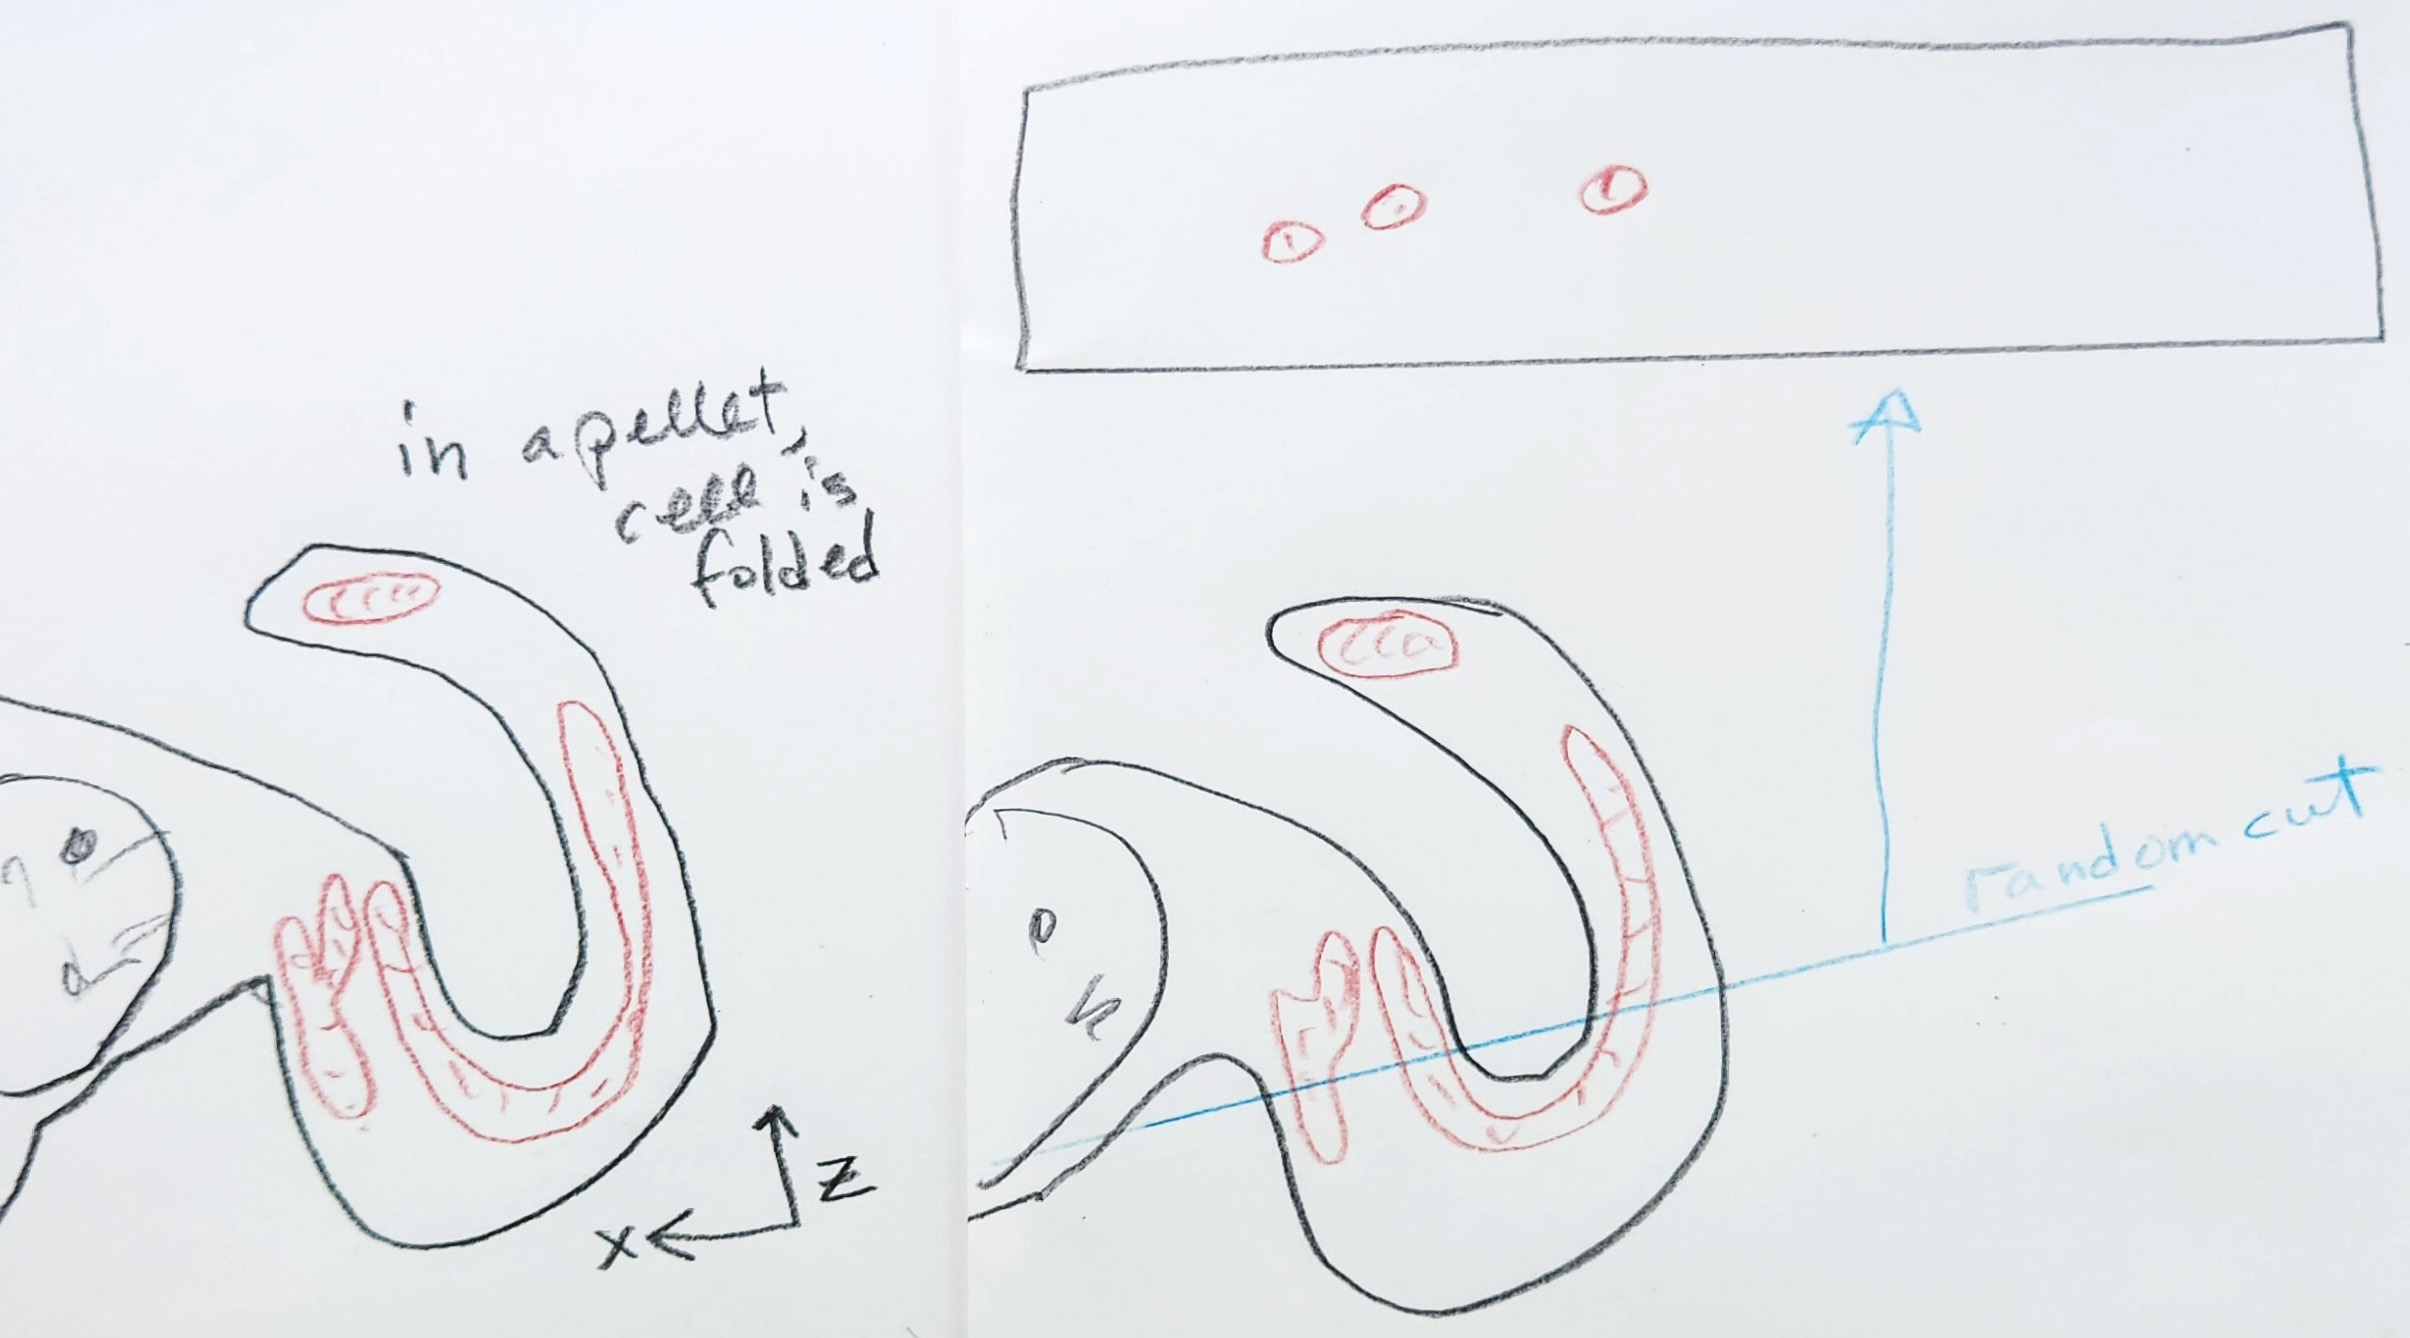
Drawing of a cell plated on a glass coverslip seen from the side. Red are mitochondria withing a spread region of the cell that is approximately half a micron thick from bottom to top.
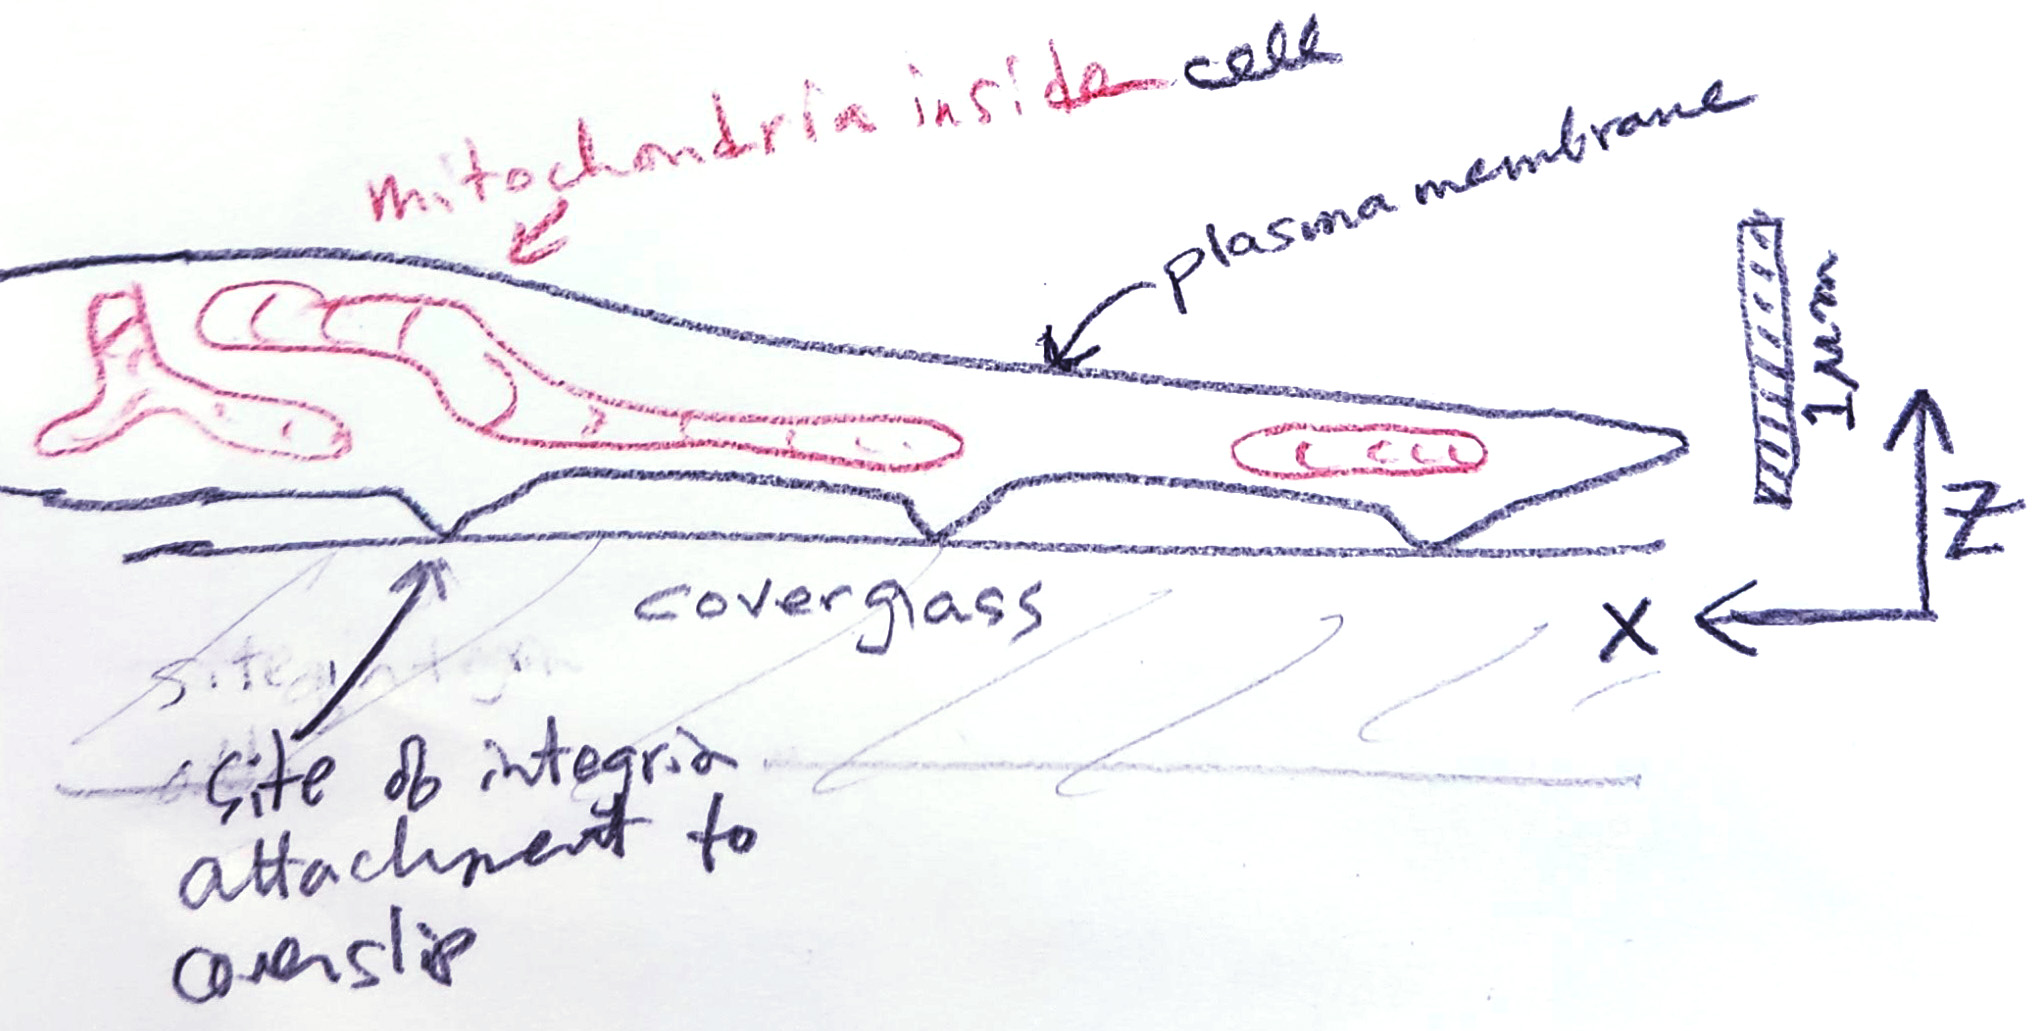
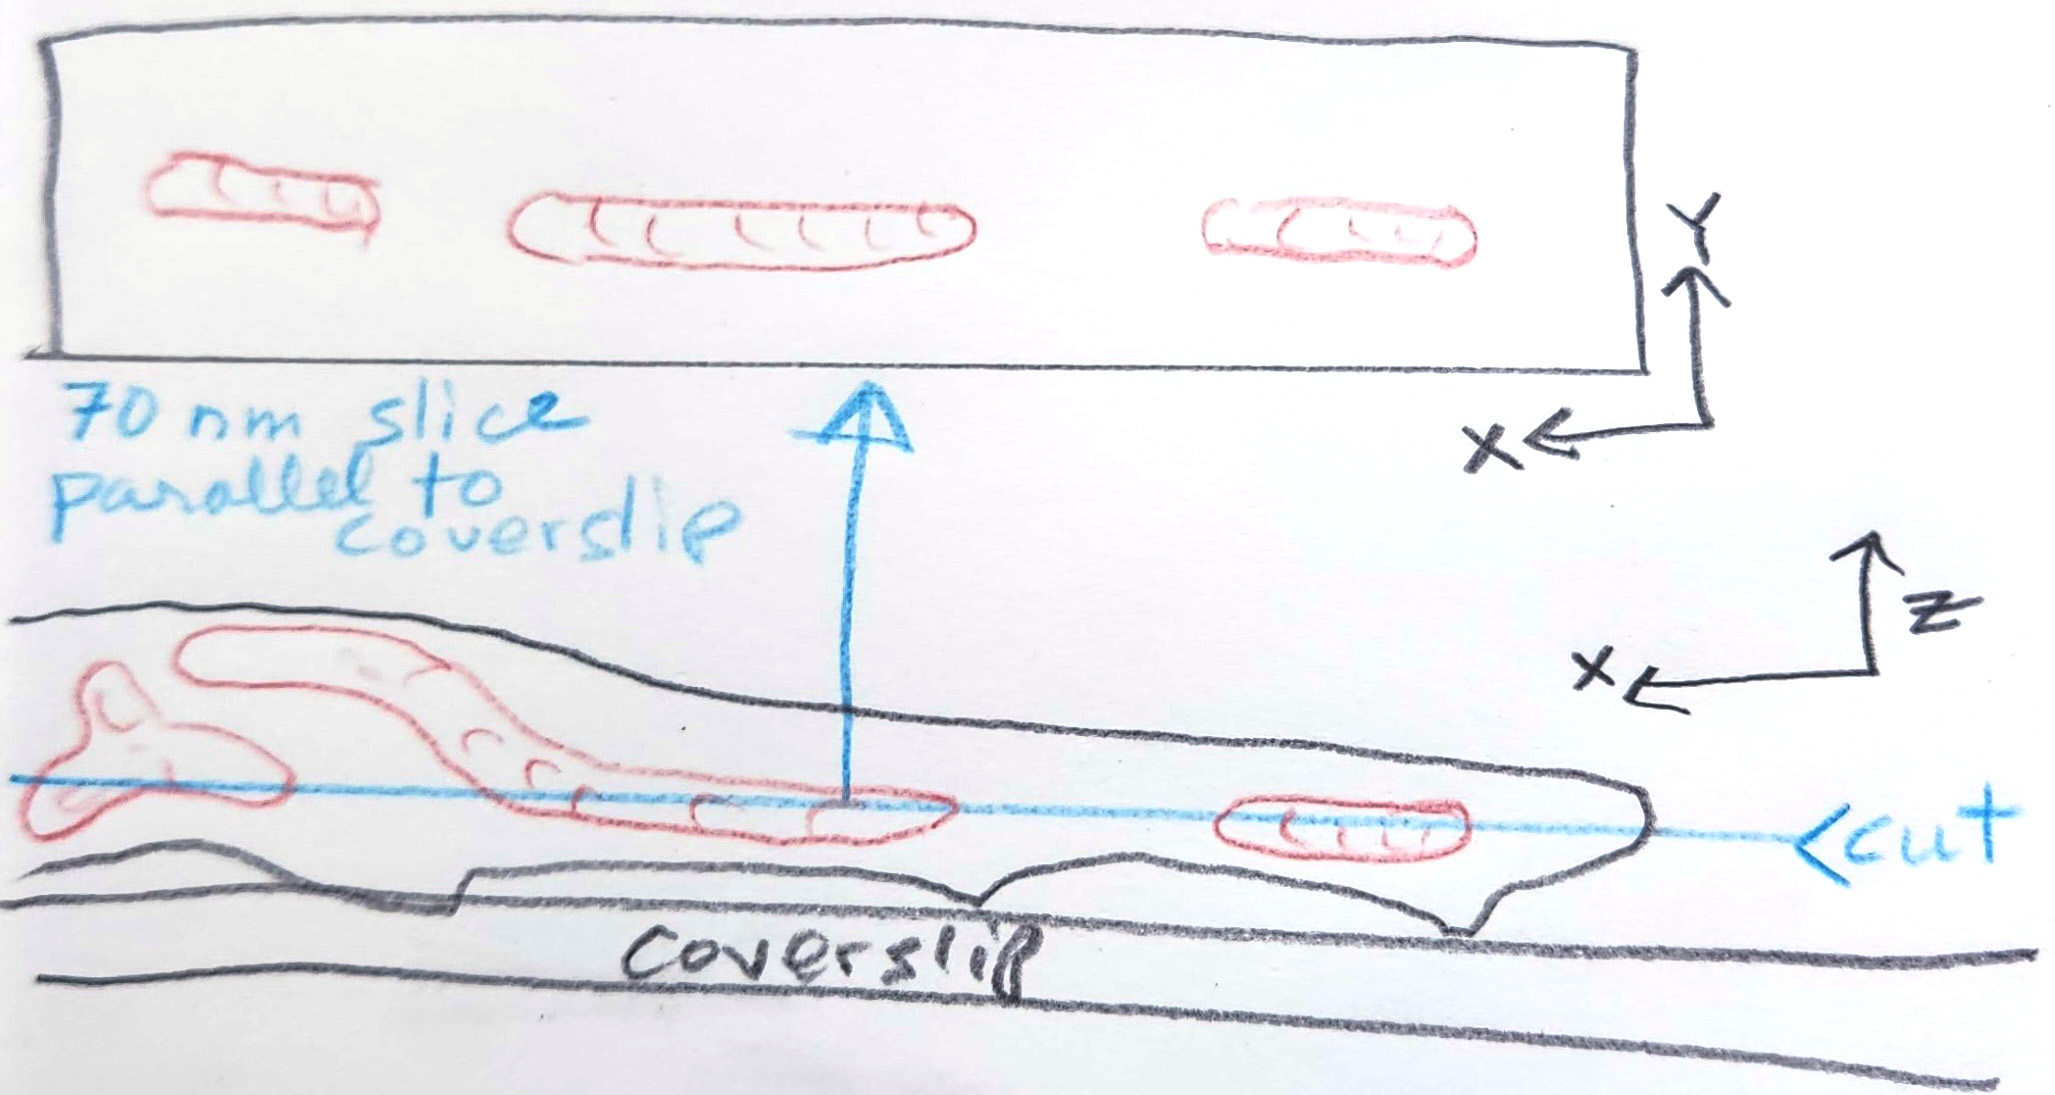
If this cell were sliced with a 70 nm thick plane parallel to the coverslip, some mitochondria would appear shorter than they are and may lose oher features such as branches.
To get more cells into a field of view and to simplify embedding and sectioning, TEM prep typically involves lifting cells off the plate and spinning them down (pelleting them). This changes their orientations, typically folding them and making the tomograms random. Illustration of the same cell in a pellet (not depicting any neighboring cells). Note that a random cut results in the appearance of three small mitochondria from two mitochondria with very different morphologies than the real thing.
Regardless of pelleting, which isn't relevant in tissue samples, in the following example of two random cuts of a single long mitochindrion, one slice depicts four short mitochondria and the other cut represents two short mitochondria. In each slice, the is no way to know if the resulting mitochondria are independent structures or attached structures. In both cases, the length is severely underreported.
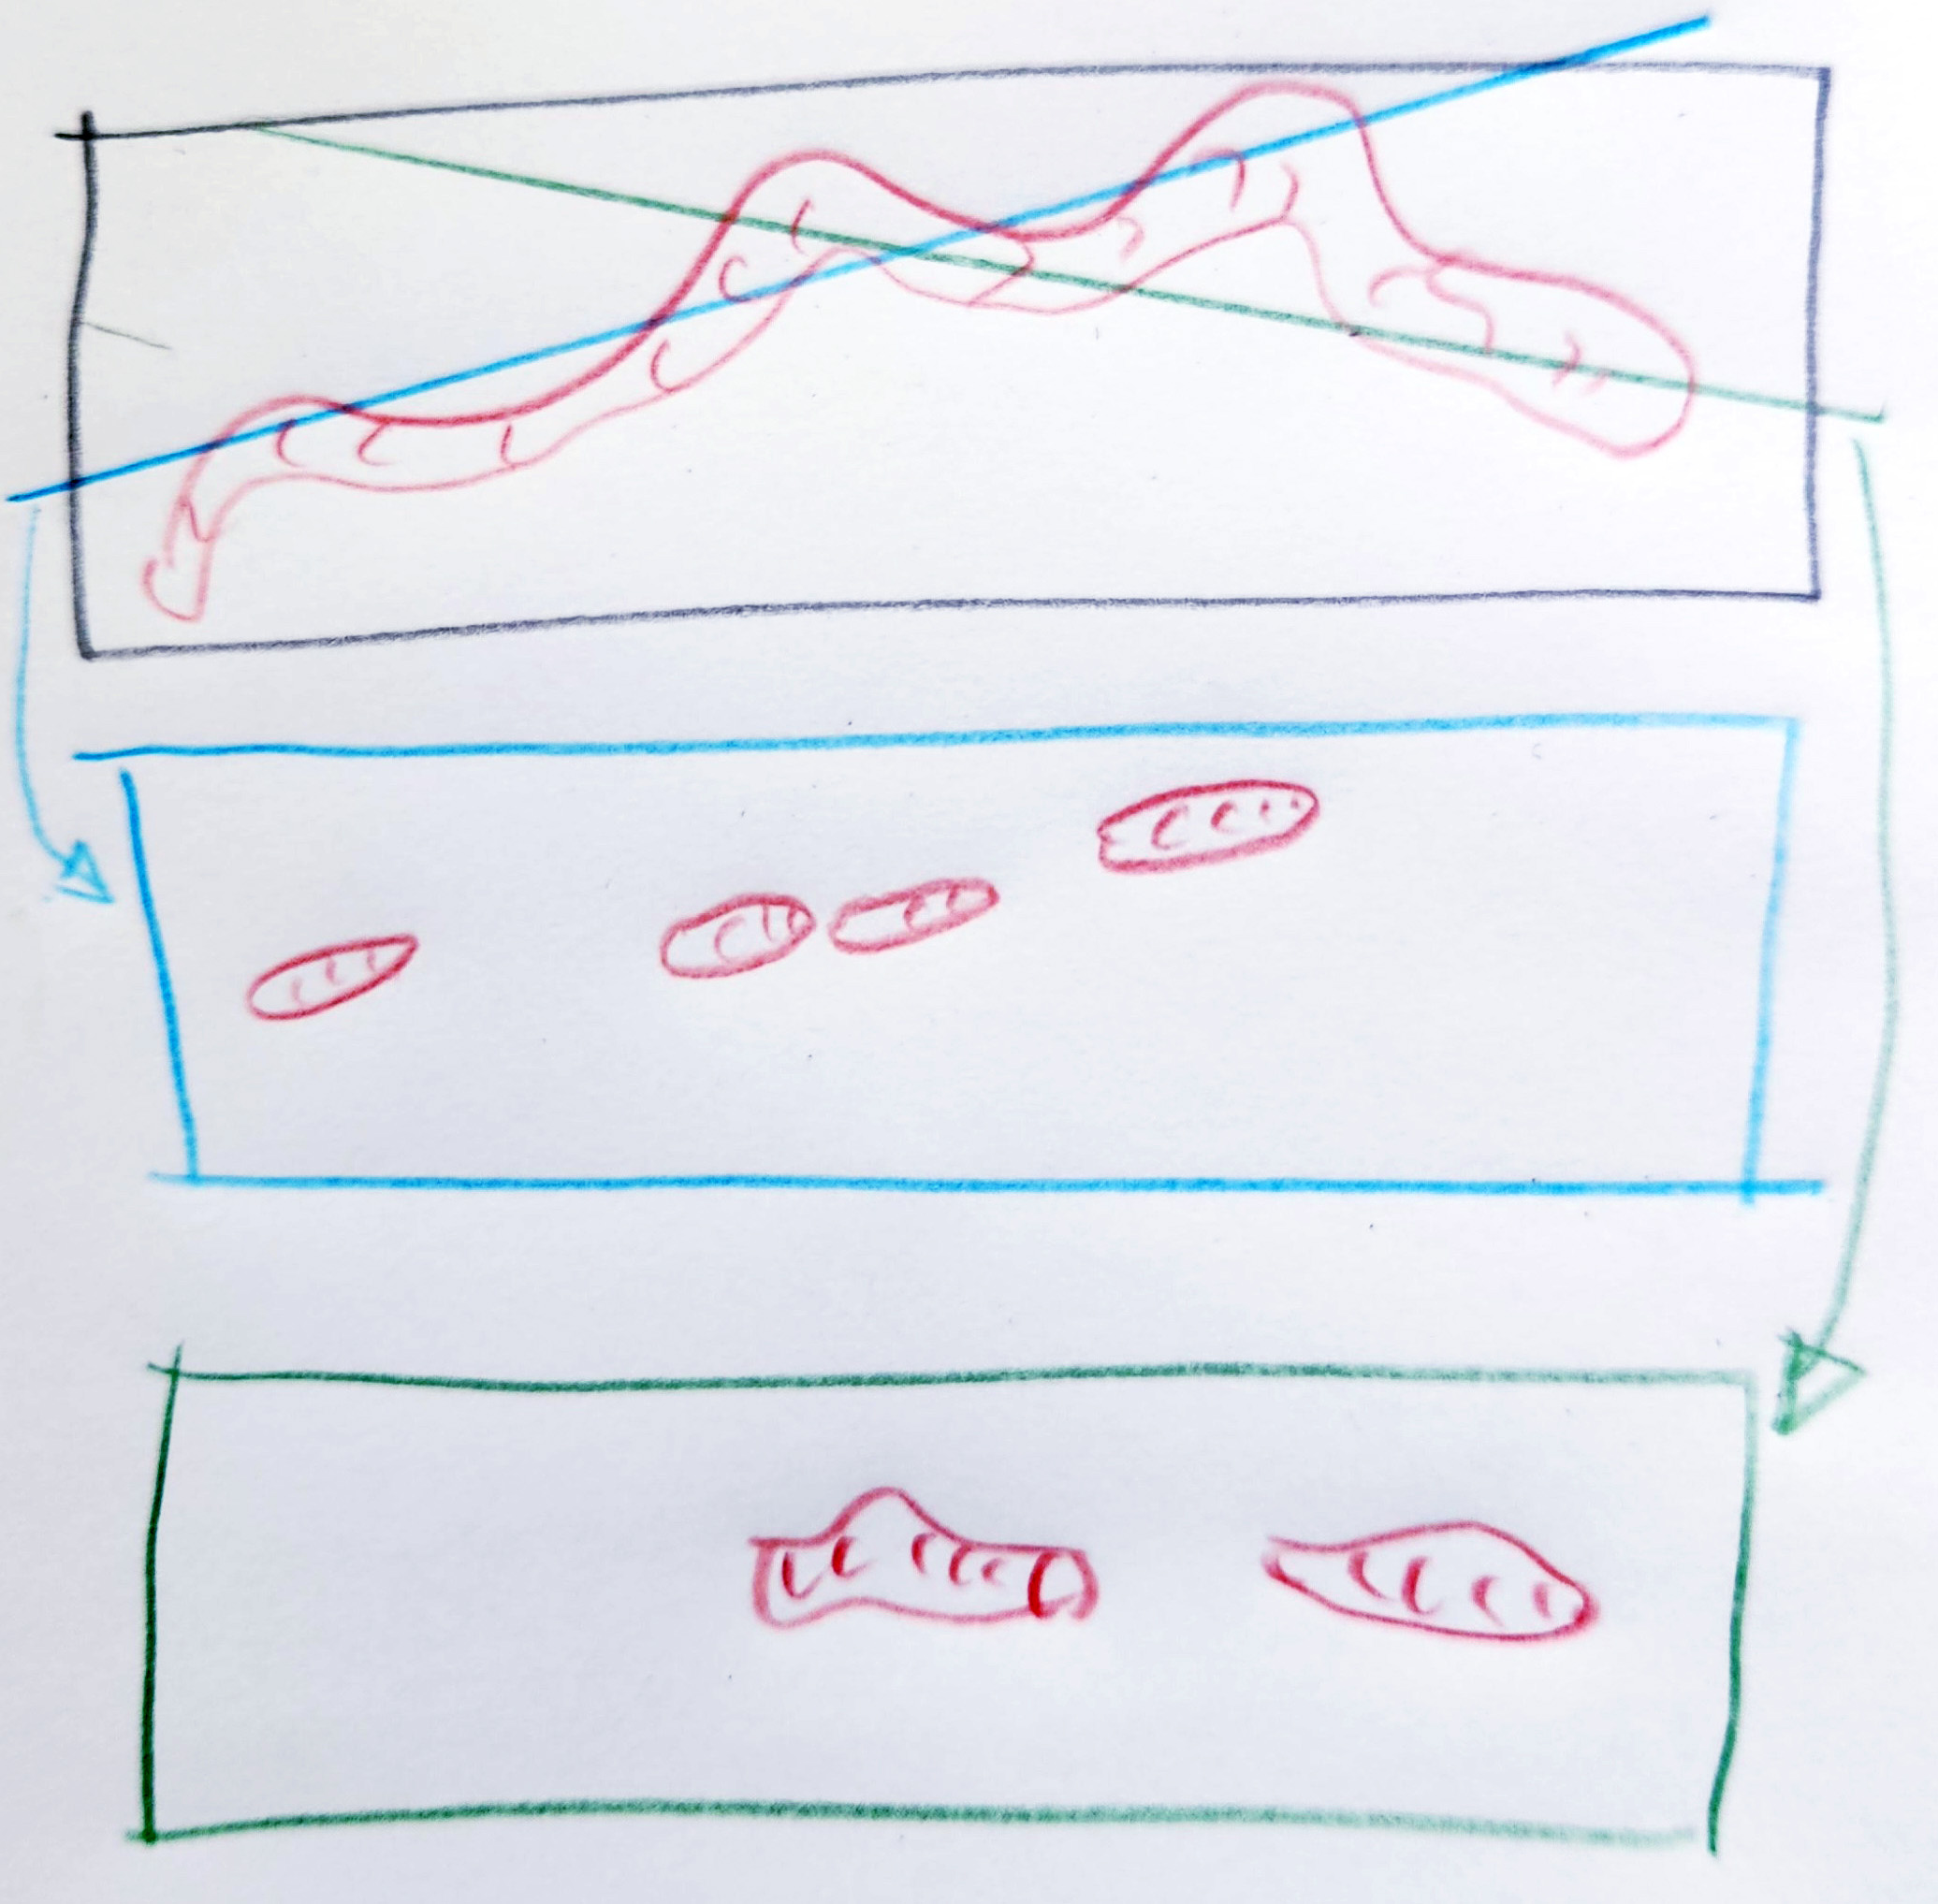
Unlike known objects, such as small spheres, there is no way to correct for distributions of 2D figures representing 3D volumes because there are too many unknowns.
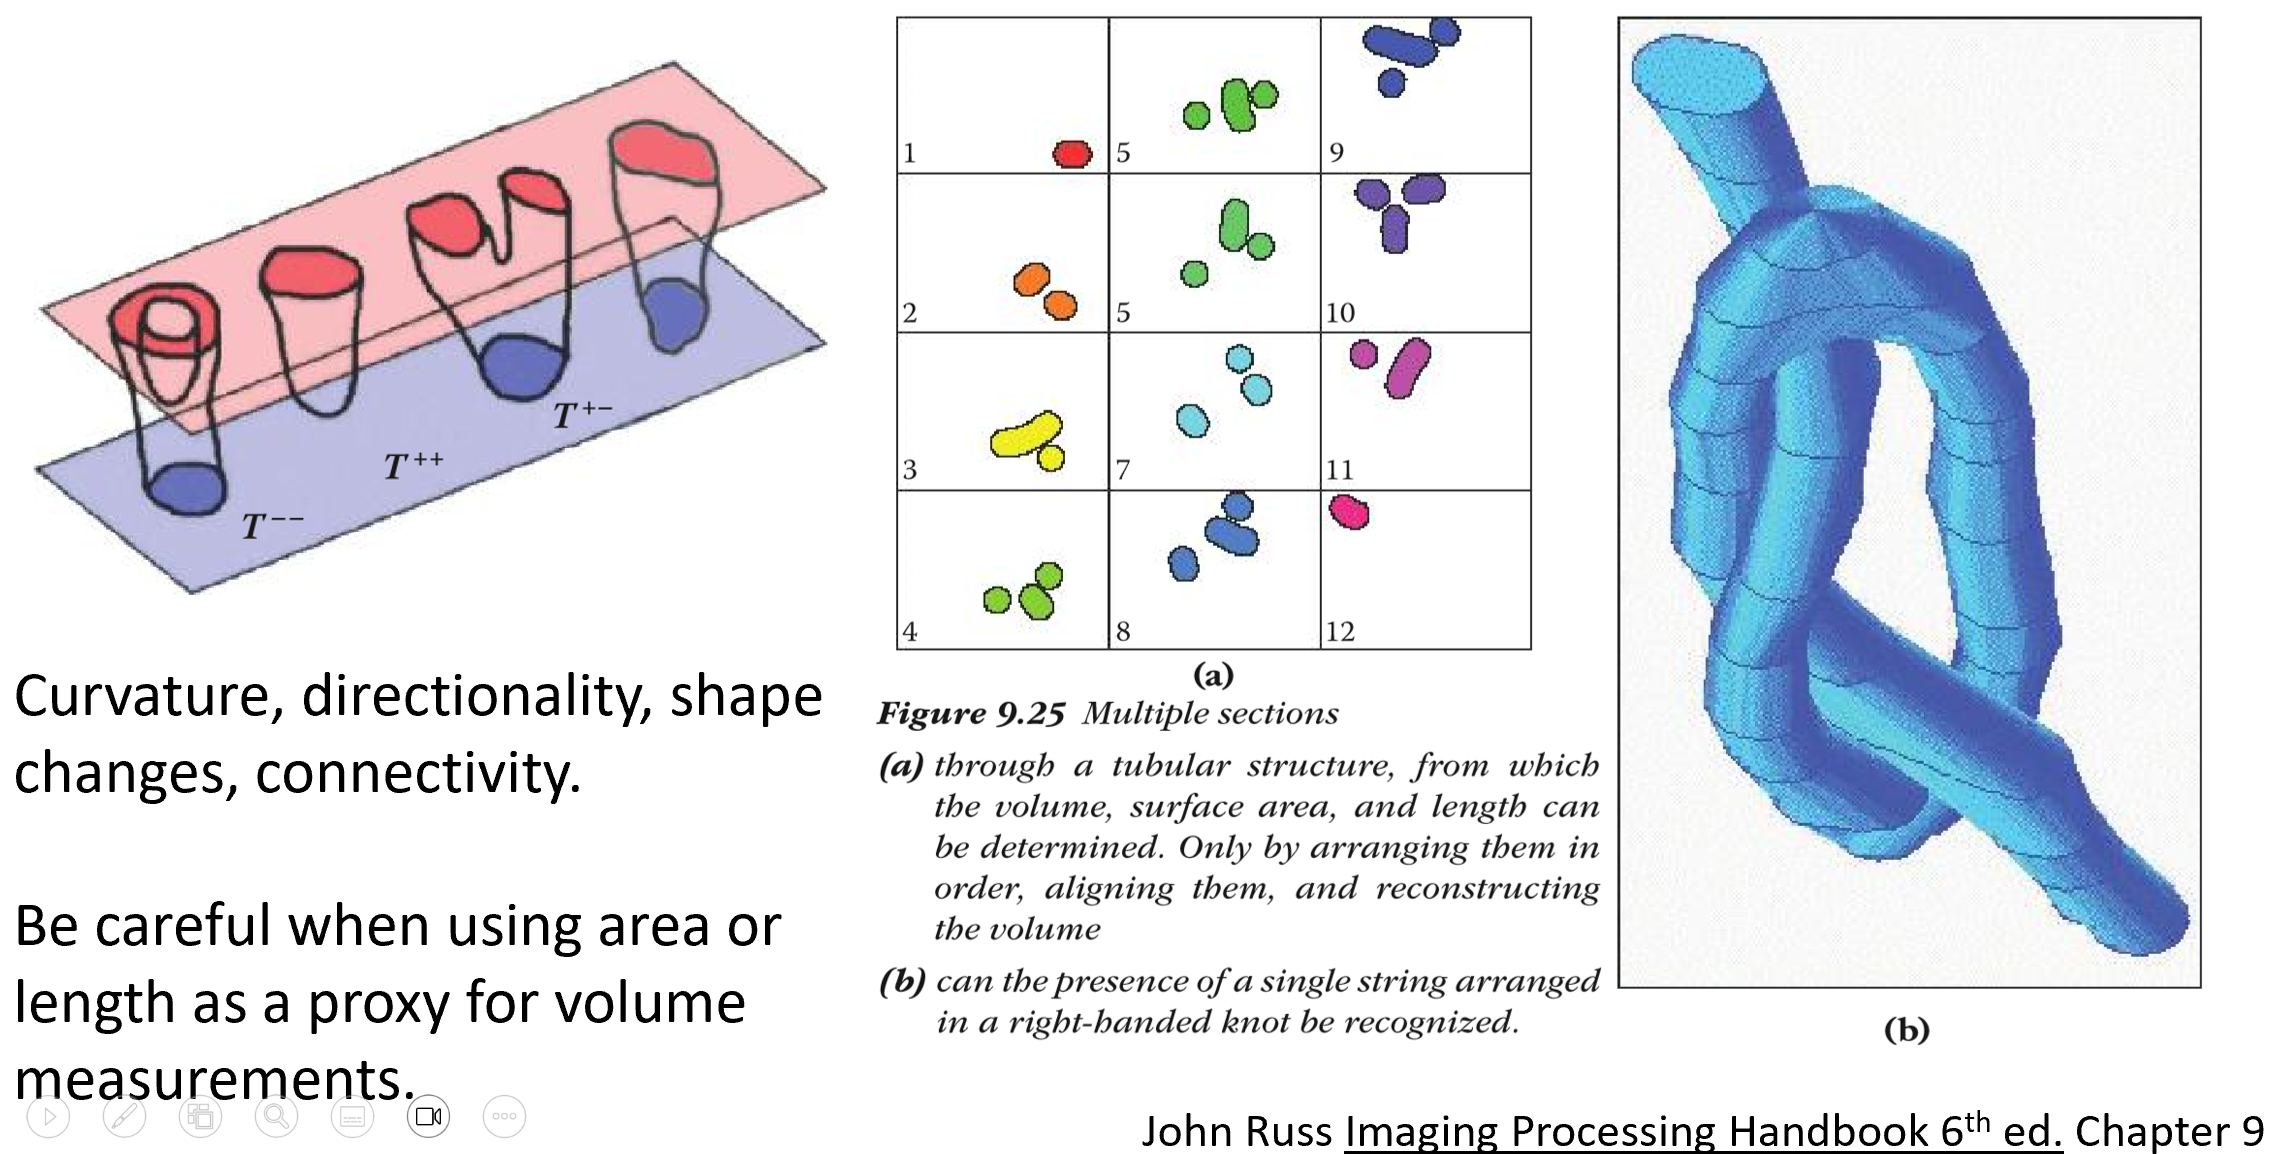
General problem illustrated in John Russ Image Processing Handbook.
Mitochondria imaged in a confocal Z series maximum projection vs a TEM. (ignore the orange box)