Nikon inverted microscope
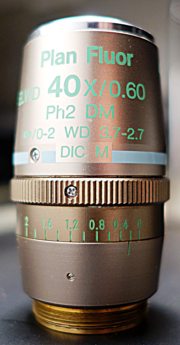
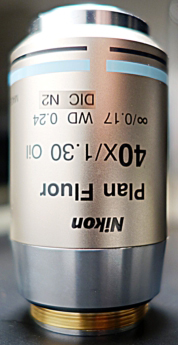
There are two 40X lenses. Which 40X lens should you use?
The one on the left is designed for tissue culture plastic. It will work with coverslips, but has a ring on it that needs to be adjusted. It is an air objective. DO NOT put oil on it!
On the right, the 40X N.A. 1.3 lens with oil is designed for #1.5 coverslips only and higher resolution.
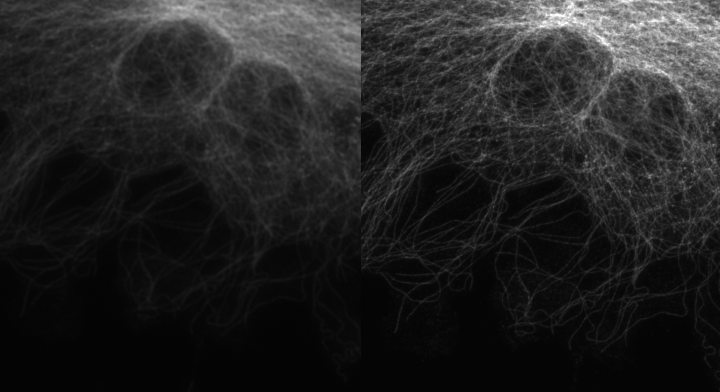
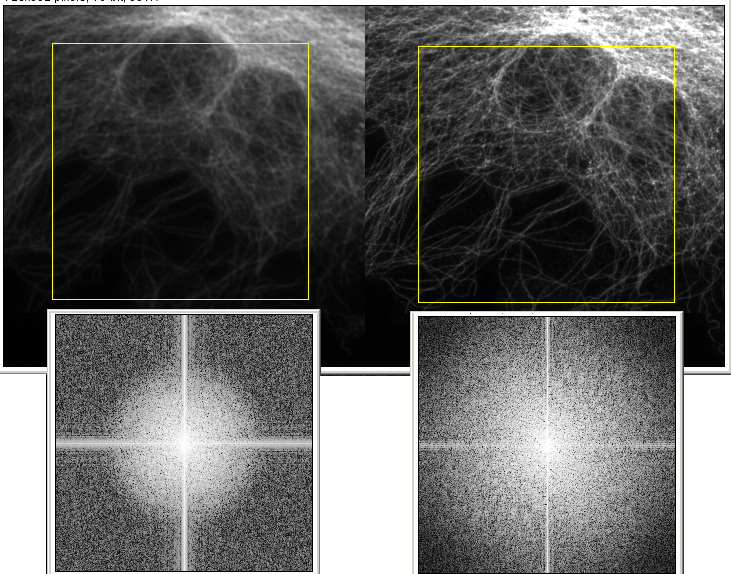
Left: Image taken with 40X N.A. 0.60 lens, exposure time 800 ms, camera set for low gain 10 MHz readout
Right: Image taken with 40X N.A. 1.30 lens, exposure time 100 ms, camera set for low gain 10 MHz readout
The image on the right looks crisper than the image on the left. It is higher resolution. (More technical detail below.)
The image on the right is approximately 8X brighter than the image on the left. (We know this because the exposure time is 8X different to get pictures of equal intensity although some of this is due to differences of incident light as well as of detected light.)
Here is a better example of the relationship between light throughput and N.A. Keep in mind that in this case, there is more light both for the excitation of the fluorophore and in the collection of the emission.
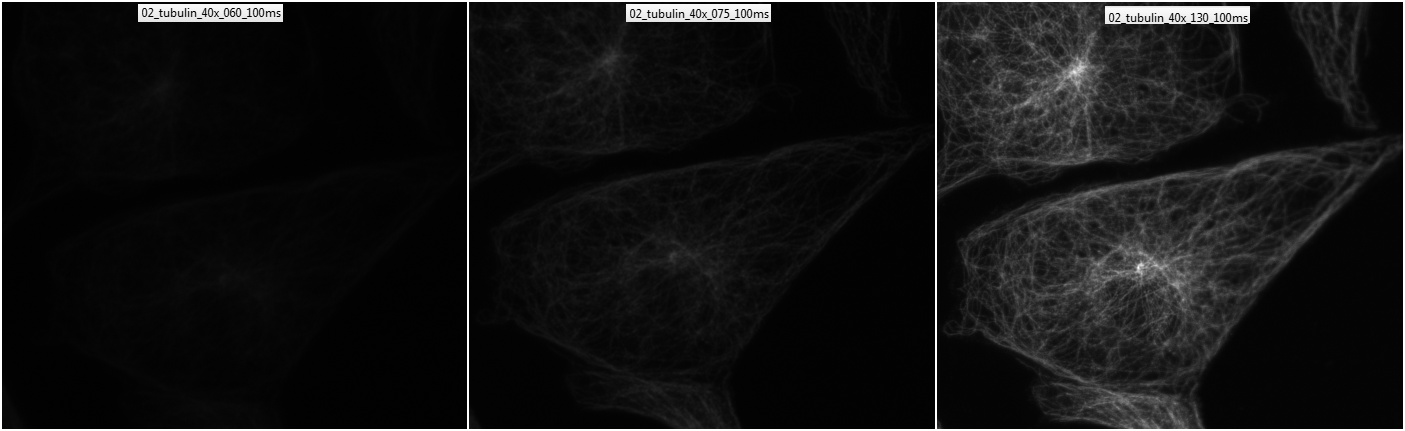
Conclusion: for cells on a coverslip, use the 40X N.A. 1.3 oil immersion lens.
To get the best resolution, you need to adjust the collar.
As pictured, the adjustment is a little bit too far open for a #1.5 coverslip, but close enough. If you were imaging through a plastic tissue culture dish, the setting would likely be between 1 and 2. (The units are mm.)
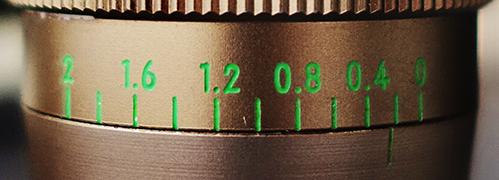
You cannot easily see the collar underneath the stage. Therefore:
1. Focus on sample best possible.
2. Reach under stage to turn ring on objective a little.
3. Refocus, turn ring, and repeat until image has maximum crispness.
Also, this may also be done when in the fluorescence mode. It is important to make this adjustment or else your pictures will not be in proper focus.
Another way to look at the spatial resolution is to look at the distribution of frequencies within the images. The image on the left shows frequencies concentrated in the center; these are more low frequencies. The Image on the right shows a broader distribution with frequencies spread to the edge of the power spectrum; these are higher frequencies. Seeing smaller things is seeing higher frequency information. This is finer spatial resolution.
.
comments, questions, suggestions for this web page: Michael.Cammer@med.nyu.edu or mcammer@gmail.com