Shortest distances from multiple features to one (usually larger) feature
This page describes marking a field of isolated cells and having the shortest distance from each of their centers to the perimeter of another feature measured.
History
In ancient times (circa 1997) we wanted to measure the distances and density of actin nucleation sites in relation to the leading edge of spread cancer cells grown in culture (Bailly 1999). Figure 5D shows a schematic of distance from front edge to interior of cell and Figure 4 shows where the membrane position was set for morphometric analysis. These counts were being done manually. The goal was to at least semi-automate the measurements. For instance, the user would click on all the nucleation sites to record the positions and would draw a freehand line. The algorithm is a simple brute force compare each point to every point on the line and save the shortest one.
The first iteration, which we called "ship to shore" (webpage lost), was followed by the analysis of salt crystals formed relative to the initial edge of a drying puddle during spring thaw.
A commercial image analysis software company took this brute force approach and applied it in 3D to measure the shortest distance from transcription sites within nuclei imaged by FISH to the outer surface of nuclei labeled with lamins or another surface marker. In macro implementation, this can get slow, but compiled C++ or Java is fast enough to allow for comparing surfaces as well as centroids to perimeters.
The current version was resurrected to look at structures in the CNS, spleen, and lymph nodes. The first was very simple distances to a freehand line with random colors drawn for each line to distinguish them in dense areas. The second version required the reference shape to be a closed area so that objects inside would have negative distances to the perimeter and objects outside would be signed positive. The third version saves the results to a tab delimitted text file in the same directory as the original image.
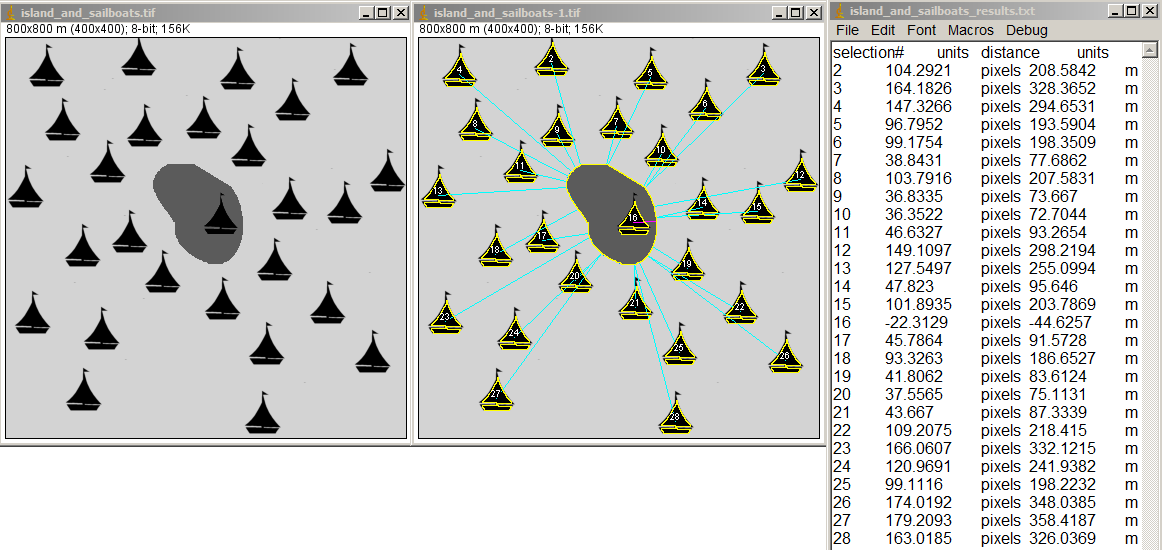
To create the example above, the original image calibrated in meters had the regions of interest marked and the macros applied to get results. Note the the boat on the island (#16), which was washed up and beached in Superstorm Sandy, has a negative distance from the perimeter of the island.
Now pretend that the gray spot in the center is a lesion, the sailboats are immune cells, and the scaling is is um. Now it's useful for microscopy.
This version distance_ macros_v104.txt allows for the big reference object to be a closed shape, a line of any type, or a point (or multiple points). We decided not to add a convex hull feature to close open lines to define inside/outside.
Based on the second and third versions above, we are rewriting this to allow for multiple large regions of interest (islands) to be measured. This will mean that the large ROIs will be at the end of the ROI Manager list and the user can put an unlimited number of them at the end. The results table will list the results for each ship to each shore.
Of course, there maybe problems with this analysis. One is that the greater the perimeter varies from a circle, the less likely it may be valid. And, of course, 2D slices don't necessarily represent paths traveled in 3D. Then there's the whole issue of lineararity versus random or fractal paths...
comments, questions, suggestions: Michael.Cammer@med.nyu.edu or mcammer@gmail.com