Macro to radial reslice for ImageJ 1.52a Version for color images here.
Install this: radial_reslice_with_plot_v100.txt
Save on your computer and Plugins > Install...
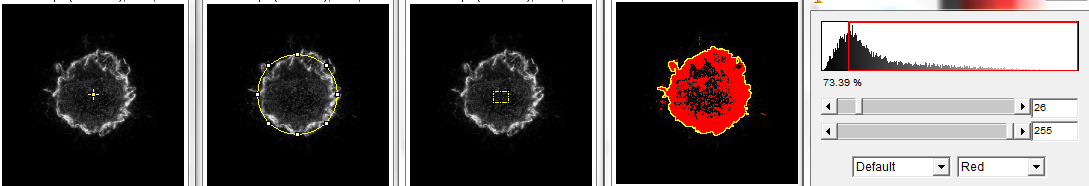
First step, define a region of interest to on an image such that a center point can be located. In the following, from left to right, 1.) point tool, 2.) circle around the feature, 3.) any region of interest drawn by the user, and 4.) threshold followed by magic wand tool.
Next step, run the macro. Simply type the letter q.
Resulting in the following image and plot where the plot is the average of all Y pixels along the X axis, a.k.a. the average intensity from left to right.
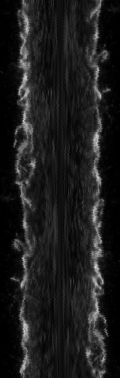
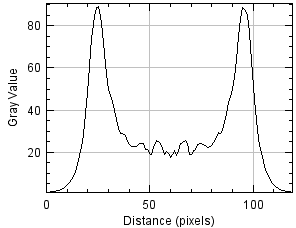
Under the plot, click List to see the numbers to copy and paste to another application or Save to send to disk.
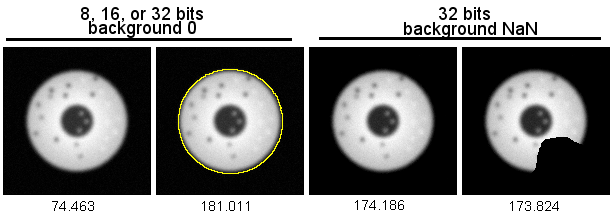
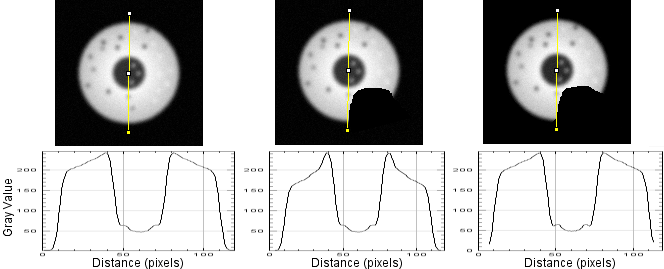
The following explains why you may want to change background pixels to NaN before measuring.
Circle at far left is on a background of noise mostly ranging from 0 to 10.
Measuring the entire field averages in the background values for a mean intensity of 74. (Mean intensity below each panel.)
If the circle were a real cell we wanted to measure, clearly, we would not want the bg values.
Therefore, we usually trace or threshold. In the 2nd panel, the feature is traced and the mean intensity of 181.
Another trick for masking or tracing is to convert to 32 bits and set the background values to NaN. (This is
especially useful for measuring small things like mitochondria, but this is for a different webpage.)
The 3rd panel shows the background set to NaN using the code:
run("Select None");
changeValues(0,10,NaN);
and then the full field measured.
And cutting a notch out of the object with bg set to NaN means that there needs to be no tracing to limit measurements to the object. (The bg threshold high as changeValues(0,20,NaN) instead
of 10 would make the mean closer to 181.)
The following figure shows radial reslices of, from left to right, a circular object with the background set to low numbers, a notch cut out of the circle with bg set to low numbers, and the background set to NaN. Note that the profile plots of the full circle and the one where notch pixels are not included in the measurement have the same profile. The one (center) where notch pixels are counted has a profile that accurately represents the diameters, but not the object being measured along each diameter. (At the base of the curve, NaN not reported on plot.) This argues strongly in favor of setting a threshold for the background and replacing with NaN.
The reslice output of the intact cell and the one with notch:
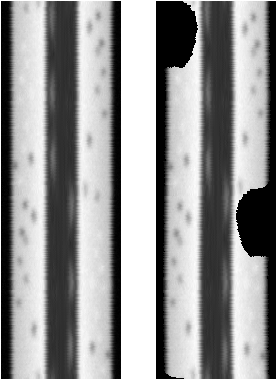
There is a fast way to get the numbers, but it doesn't give the image and would require additional code
to output as a diameter plot. In this case, the center of the cell is at the left and the periphery at the right.
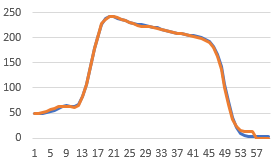
Using this macro radial_reslice_and_concentric_with_plot_v100.txt
concentric circles are put on the cell and intensity of pixels along the circumference are measured.
This graph is not the same Y scale as the ones above, but it does show the same result.
The diameter reslice image output should be achievable too by getting the pixels along the circumference Roi.getCoordinates(xpoints, ypoints) followed by getPixel(x,y) for each and then putting into an image after fitting each to the longest perimeter using Array.resample(array,len). It would probably be best to get the largest circle first and then work in. Anyhow, this is how I'd go about coding it.
Variations.
Similar method, but not symmetrical because only PI rotation, not 2PI.
https://www.frontiersin.org/files/Articles/17690/fimmu-03-00230-r2/image_m/fimmu-03-00230-g002.jpg
This one, the cells themselves were rotated.
https://www.frontiersin.org/files/Articles/17690/fimmu-03-00230-r2/image_m/fimmu-03-00230-g003.jpg
This shows that you can sort the plots based on intensity at a given location along the diameter.
https://www.frontiersin.org/files/Articles/17690/fimmu-03-00230-r2/image_m/fimmu-03-00230-g005.jpg
Other notes:
The radial reslicing is the reverse of the annulus method we used for measuring actin polymerization and arp2/3 localization in cultured cells many years ago.
http://microscopynotes.com/imagej/annulus/from_aecom/
http://microscopynotes.com/imagej/annulus/chan1998.pdf
http://microscopynotes.com/imagej/annulus/bailly1999.pdf
Then it was used for other proteins...

It can also be used through time and Z series.

Other related things:
https://www.flickr.com/photos/mcammer/38455790206/
https://www.flickr.com/photos/mcammer/2976471330/
https://www.flickr.com/photos/mcammer/36951565725/
https://www.flickr.com/photos/mcammer/2933513416/
The bottom is the top resampled:
https://www.flickr.com/photos/mcammer/2185411747/