Mulicolor Plot Macros for ImageJ, last updated May 2019
| In 2024 these macros were replaced with "Multichannel plot profile" in MC_macros.ijm which also produce a table with the intensity values of each channel. They may also be used with a macro which regularizes the length of the plot centered on a feature of interest. |
|---|
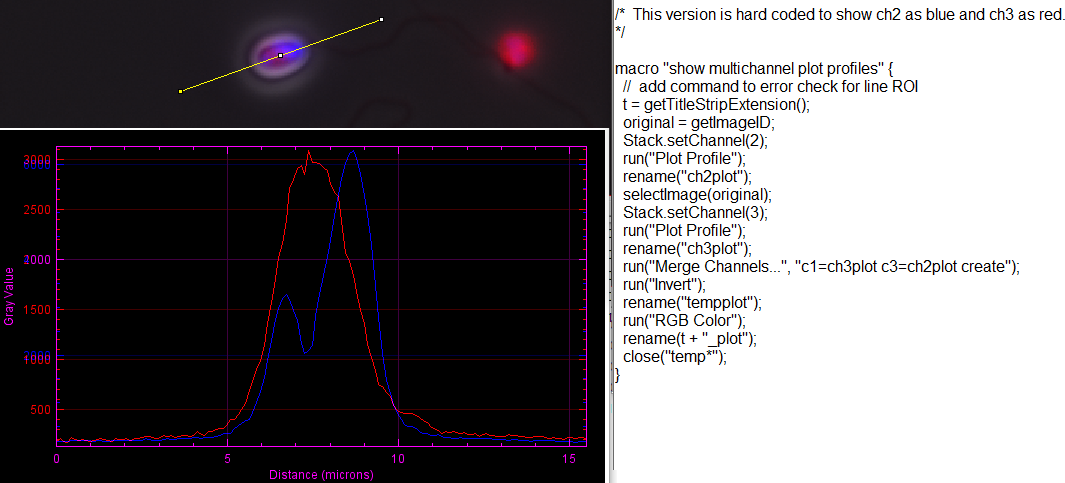
Programmed to work with composite images. Could be used for RGB images by splitting channels and remerging or by converting to RGB stack and the converting stack to hyperstack.
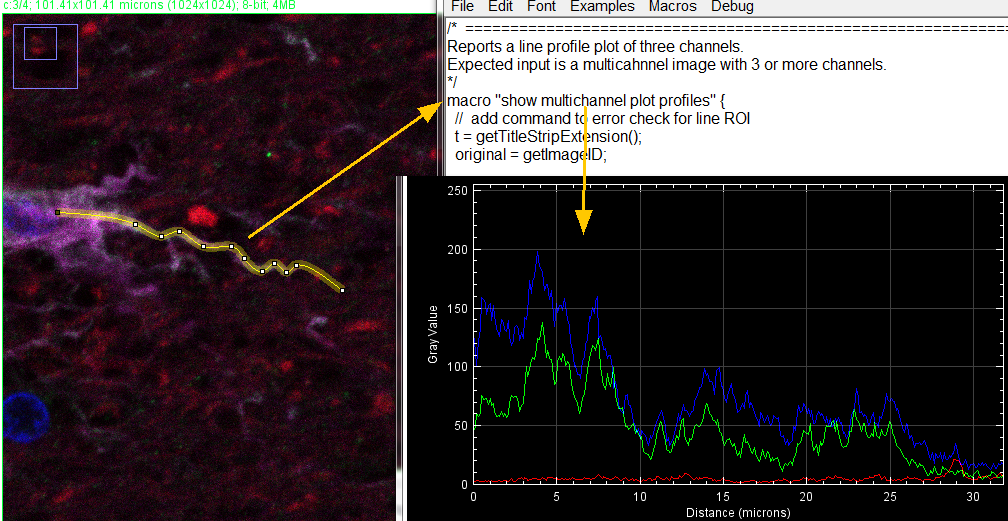
The first version: this macro multicolor_plot_v100.txt illustrated below:
Output could easily be added to have intensities output in columns to be read into Excel, Google sheet, or other data analysis software. Or calculate a correlation coefficient directly in ImageJ.
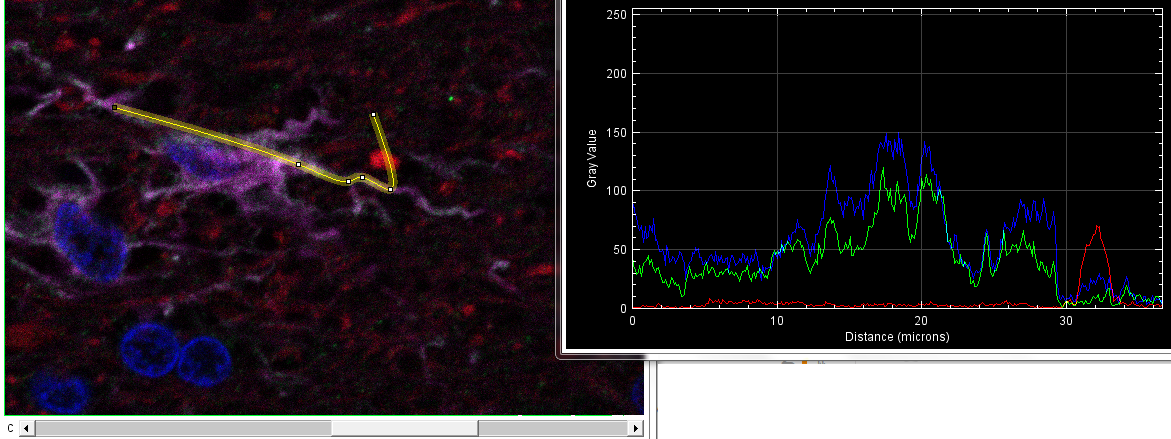
Modified for three colors from a Zeiss confocal: multicolor_plot_3colors_v102.txt and packaged with other macros.
Two examples, the first on raw data and the second after applying a rolling ball with 50 diameter.