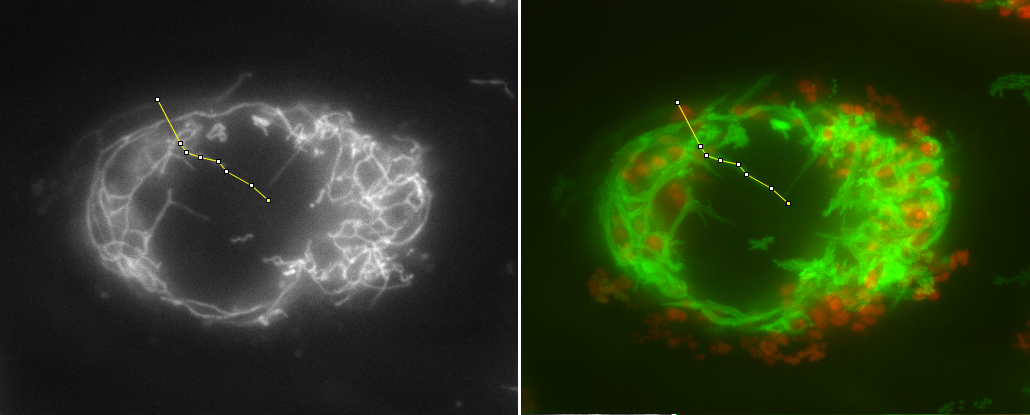
Single timpoint of cell at left and max projection through tiepoints at right. ROI for kymogram marked in yellow. (Scalebar in movie below.)
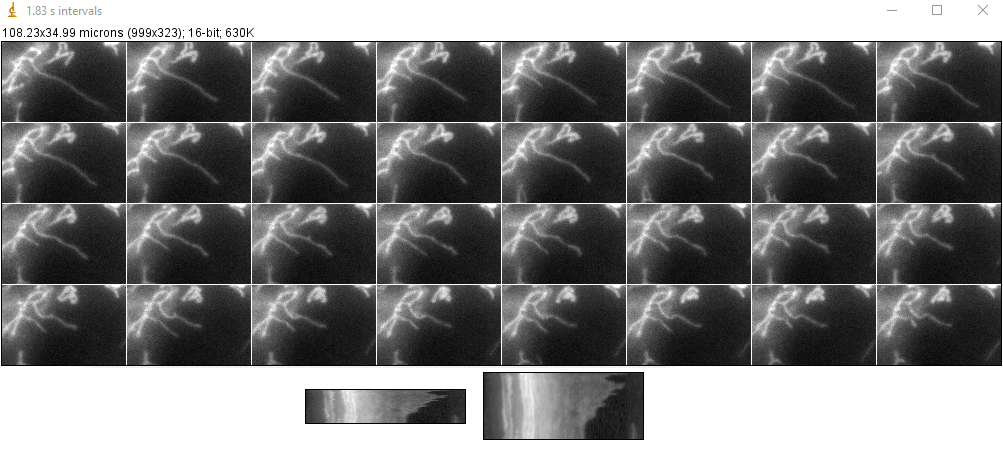
Montage of timepoints with kymogram at bottom. at left, each Y pixel = 1.83 seconds. Scaled to 0.915 sec at right so easier to see.
Animated GIF. Image below should be displayed as a movie.
-------
Link to other mitochondria movie with same microscope.