
What these instructions are for.
These instructions are for simple analysis of cells in culture labeled with fluorescent probes. The intensity of fluorescent probe (or expression of fluorescence e.g. with GFP) is directly proportional to the amount of the thing bound to the probe (typically a protein or nucleic acids). This page was written using NIH-Image or I.P. Lab software but is essentially the same with ImageJ.
What "is directly proportional to the amount of the thing bound to the probe" means.
In the following example, the background has a value of pure black. We call this zero. This is important as we will see later. The brightest measurement we can make is 255. This means that we have a grayscale from 0 to 255 where 0 is no molecules and 255 is completely saturated.
Intensity is directly proportional to number of molecules. The mean is the average concentration and the sum of all the pixel values represents the total mass.
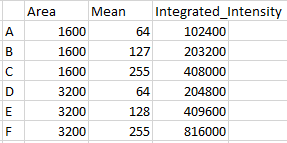
A, B and C each are square cells with sides 40 X 40 pixels. This means that the total area of each cell is 800 pixels. D, E and F are exactly twice (2X) the area.
Each cell has been labeled via immunofluorescence with our top secret antibody for protein X. Cell B is a wild type cell. Cell A is an underexpressor. Cell C is an overexpressor.
If we trace each cell and measure its average or "mean" intensity, we get the
following results. This tells us that per unit area of each cell, there is an
average amount of protein X expressed art the following levels.
A. 64
B. 128
C. 255
Cells D, E and F have the same mean intensities. They have the same
concentrations of protein X per unit area.
D. 64
E. 128
F. 255
The mean intensity or concentration does not provide information about the total mass of the protein in the cell. Total mass is integrated intensity, the sum of all intensities.
Thus, the definition of mean. It is the sum of all intensities for a given area (or volume or time interval) divided by the area (or volume or time interval). Technically, it is intensity per unit area (or volume or time interval), but we typically report it as arbitrary units.
The total mass of protein in the cell is the mean intensity times the area. (Actually, this is backwards. The software calculates the mean for us by adding together the intensities of all the pixels in the traced area, which is the total mass, and dividing by the number of pixels, which is the area. We have to reverse the division to get the total mass.) [To keep things simple, we're dealing with completely uniform samples. We'll deal with more realistic varying ones later.]
Practically, this means that while cells A and D have the same average concentration (mass per unit area), D has twice the total mass of protein as A. By the same mathematical relationship, B has twice the concentration D, but the same total mass.
But real cells are rarely uniform. Proteins tend to be localized differently in different parts of the cell.
These cells are stained for protein X and the image was taken with a camera that has linear response from very faint light to blaringly bright light. We traced each cell and measured it to find out the total amount of protein. Remember that the background is zero. Here are the results.
Warning: Do not use the integrated density measurement option in NIH-Image. Always use integrated_intensity = mean * area.
Let's say we have a phase contrast or Nomarski image to show us where the nucleus of each cell is. Let's compare the amount of protein in each nuclear area to the amount of protein in the rest of the cell. We will trace and measure for each cell the nucleus and the cytoplasm and put the numerical results in a table in Excel.
Looking at one condition isn't very informative, but this type of analysis can be very useful to compare distributions in cells with different treatments or phenotypes due to genetic manipulations. For instance:
The results shown here are that when the cells are treated with drug A alone, the protein leaves the nucleus and enters the cytoplasm but the protein mass of the cell remains constant. When treated with drugs A and B, the mass in the entire cell drops. More complex questions, such as the mechanism (e.g. excretion or degradation) or the relative rise in the nucleus are not answered, but a strong general trend is given.
Of course, if your secondary antibody alone control looks like this
 ,
,
then the staining in the nuclear region is background garbage and the measurments are
meaningless.
If your secondary antibody alone control looks like this
 ,
,
then everything is fine. Remember, analyses are uselelss without biological
controls.
[And what about histogram analysis and complications of distributions of signals? Look here if interested.]
Keep in mind that these examples are for cells which approximate two dimensional objects. Before translating this to biological measurements, we must decide whether this is valid in our system. Because most of our analyses are done on very flat cultured cells or in the portions of cells that are very flat, such as in the lamellipod, it is safe to use simple 2D analyses. In other systems, such as total DNA content in large 3D nuclei, volumes may need to be sampled. The discussion here is limited to 2D examples.
Real simple integrated intensity or total mass measurements.
The examples above are all simulations. Let's look at a real cells and analyze them.
This is a micrograph of a fixed cell in culture stained for f-actin.
We hand traced the cell and measured its sum (total mass), mean (concentration), and area.
The mean reported here is 89. However, unlike the example above, this cell is
on a background that may not be zero.
Hand tracings and measurements of background areas show that there is a floor (or pedestal
or background). This is in the 24 to 26 range.
Thus, we adjust the mean to be 89 - 26 = 63. This subtraction is the equivalent of making the background 0. Below is another explanation of this.
This measurement shows the plot of the mean value as we move across the area within the
dotted box. The arrows point from the regions of the cell to their intensity
representations on the graph. We are showing the concentration at a particular X
location within a box Y high.
The background around the cell is bottoming out at 26, not at 0. Therefore, the mean
value includes a lot of background.
Instead of tracing by hand, a method we often use for cell measurements is to use an
intensity thresholding method.
And, as with the hand tracing method, we can find the background.
But regardless of which method we use, the answers are the same.
total_mass = (raw_mean * area) - (background_mean * area)
as shown by geometry
and which can be reexpressed as
total_mass = (raw_mean - background_mean) * area
At this point it makes sense to mention that the maximum value must not be saturated.
Just as we intentionally clip the bottom values in the category background,
saturation would clip the measurement of total mass.
Compartments
The cells can be hand traced or have features autextracted to do measurements on different structures.
(above last revised 7 jan 2002 -- below added dec 2016)
Another example where all cells have same number of molecules and as area increases, mean intensity drops.
Let's say that each of these circles represents a flat adherent cell and that we have stained all of a protein with Alexa-488 and we're imaging with a widefield epifluorescence scope with a low numerical aperture lens.

The intensity represents the amount of stained protein in the cell. By changing the lookup table the intensity differences are more obvious to the eye.
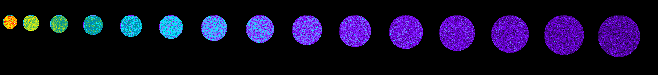
If we measure each cell, the sum of the intensities of all the pixels are the same. This is because every cell has the same number of molecules.
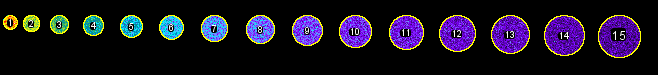
This ImageJ 1.51 macro defined the cells, but it's the same for real cells; this works particularly well on cell cultures where the cells are flat and isolated from each other.
Adding in irregular polygons also allows for analysis of overlap or colocalization or interactivity.
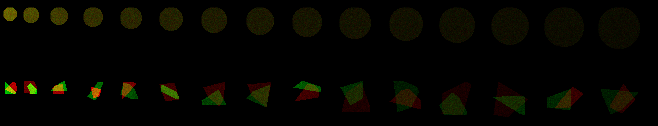
Color look up tables are used above because we are bad at interpreting subtle intensity difference and how we perceive intensities is highly reliant on local contrast.
Load the green image above into ImageJ. You may be able to drag and drop it directly from this web page. Convert to 8 bits and measure each spot. The integrated intensity should remain approximately constant.
run("8-bit");
setThreshold(1, 255, "raw");
run("Set Measurements...", "area mean integrated redirect=None decimal=2");
run("Analyze Particles...", "display clear");