Take home message:
Fiji colocalization plugins give inconsistent results.
Not being able to set a constant threshold, especially in experiments where channels may have variable intensities due to biology; they may get thresholded to be artificially similar.
Not done yet, compare to Imaris.
The below analysis was done in late 2019. It was repeated on Zeiss confocal cell culture neuron data in April 2020 and coloc2 failed to return useable answers. Wonder how many people pull down the menu, run the plugin, and publish.
For all examples on this webpage, images are widefield fluorescence of cell culture fixed and stained for f-actin. Z series was collected and one image is a maximum pixel projection of slices 3 and 4 and the other is of slices 4 and 5. Therefore, the correlation may approach 1 but should never equal 1.00. We think the answer is r = 0.9974 for one of the cropped versions which takes into account all values > 0. One issue appears to be the inability to turn off automatic thresholding in the Fiji routines.
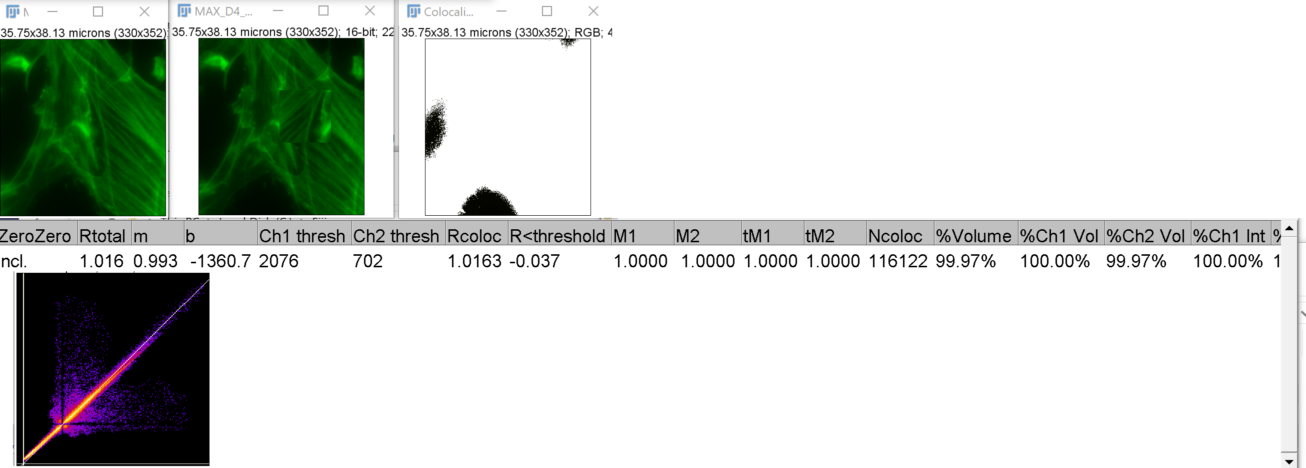
In the first example below, one of the images has a small rectangle in the middle region flipped horizontally. The Analyze > Colocalization>Colocalization Threshold command returns r =1.016 but the scatter plot shows values that diverge from a line with a slope of 1. Also, with the flipped box in the middle, comparing the full images returns r = 0.95 using a method of putting all the pixel values in a staistics routine to calculate Pearson's r. One difference is that the Fiji routine does automatic thresholding. (Image spatially scaled for display 50%.)
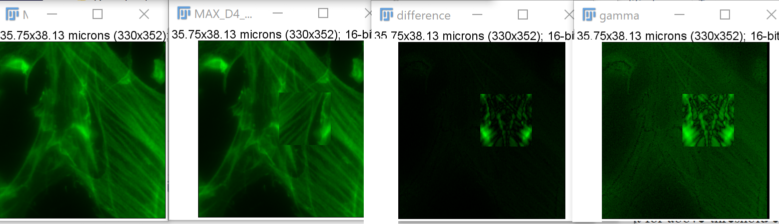
Also, a difference image shows that the two images are not the same.
From left to right, the original images, difference of the two, and gamma 0.5 to show the low intensity values.
With Coloc2, the following values are returned.
A word about the warnings: this portion of the image was cropped from an image covering more than 16X the area and was adjusted with background from zero. Also, we are looking for statistics without massaging the data first. Pearson's r, bolded below, is correct, but the other values, with decimals out to three places implying precision, are unlikely correct given the correct reporting of r = 0.94.
Roi[Straight Line, x=0, y=7, width=256, height=248]
!!! WARNINGS !!!
Warning! y-intercept far from zero - The ratio of the y-intercept of the auto threshold regression line to the mean value of Channel 2 is high. This means the y-intercept is far from zero, implying a significant positive or negative zero offset in the image data intensities. Maybe you should use a ROI. Maybe do a background subtraction in both channels. Make sure you didn't clip off the low intensities to zero. This might not affect Pearson's correlation values very much, but might harm other results.
Warning! Threshold of ch. 1 too high - Too few pixels are taken into account for above-threshold calculations. The threshold is above the channel's mean.
Warning! Threshold of ch. 2 too high - Too few pixels are taken into account for above-threshold calculations. The threshold is above the channel's mean.
RESULTS:
Coloc_Job_Name, Colocalization_of_MAX_D4_PYCR2_012 MAX34 enh.tif_versus_MAX_D4_PYCR2_012 MAX45 enh.tif_860332662
% zero-zero pixels, 0.00
% saturated ch1 pixels, 0.00
% saturated ch2 pixels, 0.00
Channel 1 Max, 65535.000
Channel 2 Max, 62746.000
Channel 1 Min, 1753.000
Channel 2 Min, 1493.000
Channel 1 Mean, 17218.997
Channel 2 Mean, 15745.904
Channel 1 Integrated (Sum) Intensity, 2000158682.000
Channel 2 Integrated (Sum) Intensity, 1829044193.000
Mask Type Used, none
Mask ID Used, 860332662
m (slope), 0.93
b (y-intercept), -292.29
b to y-mean ratio, -0.02
Ch1 Max Threshold, 24548.00
Ch2 Max Threshold, 22572.00
Threshold regression, Costes
Pearson's R value (no threshold), 0.94
Pearson's R value (below threshold), 0.90
Pearson's R value (above threshold), 0.50
Li's ICQ value, 0.450
Spearman's rank correlation value, 0.95964845
Spearman's correlation t-statistic, 1163.1012
t-statistic degrees of freedom, 116158.000
Manders' M1 (Above zero intensity of Ch2), 1.000
Manders' M2 (Above zero intensity of Ch1), 1.000
Manders' tM1 (Above autothreshold of Ch2), 0.304
Manders' tM2 (Above autothreshold of Ch1), 0.309
Kendall's Tau-b rank correlation value, 0.8961
Costes P-Value, 1.00
Costes Shuffled Mean, 0.00
Costes Shuffled Std.D., 0.03
Ratio of rand. Pearsons >= actual Pearsons value , 0.00
The same images linear contrast adjusted with no clipping at zero and 65535 gave different results. Except for a handful of possible zero values, the images should give the same results.
Roi[Straight Line, x=0, y=7, width=256, height=248]
!!! WARNINGS !!!
Warning! y-intercept far from zero - The ratio of the y-intercept of the auto threshold regression line to the mean value of Channel 2 is high. This means the y-intercept is far from zero, implying a significant positive or negative zero offset in the image data intensities. Maybe you should use a ROI. Maybe do a background subtraction in both channels. Make sure you didn't clip off the low intensities to zero. This might not affect Pearson's correlation values very much, but might harm other results.
Warning! Threshold of ch. 1 too high - Too few pixels are taken into account for above-threshold calculations. The threshold is above the channel's mean.
Warning! Threshold of ch. 2 too high - Too few pixels are taken into account for above-threshold calculations. The threshold is above the channel's mean.
RESULTS:
Coloc_Job_Name, Colocalization_of_MAX_D4_PYCR2_012 MAX34 enh.tif_versus_MAX_D4_PYCR2_012 MAX45 enh.tif_1158883737
% zero-zero pixels, 0.00
% saturated ch1 pixels, 0.00
% saturated ch2 pixels, 0.00
Channel 1 Max, 65535.000
Channel 2 Max, 65535.000
Channel 1 Min, 0.000
Channel 2 Min, 0.000
Channel 1 Mean, 15890.599
Channel 2 Mean, 15248.779
Channel 1 Integrated (Sum) Intensity, 1845851976.000
Channel 2 Integrated (Sum) Intensity, 1771298116.000
Mask Type Used, none
Mask ID Used, 1158883737
m (slope), 0.97
b (y-intercept), -202.03
b to y-mean ratio, -0.01
Ch1 Max Threshold, 23421.00
Ch2 Max Threshold, 22571.00
Threshold regression, Costes
Pearson's R value (no threshold), 0.94
Pearson's R value (below threshold), 0.90
Pearson's R value (above threshold), 0.50
Li's ICQ value, 0.450
Spearman's rank correlation value, 0.95964845
Spearman's correlation t-statistic, 1163.1012
t-statistic degrees of freedom, 116158.000
Manders' M1 (Above zero intensity of Ch2), 1.000
Manders' M2 (Above zero intensity of Ch1), 1.000
Manders' tM1 (Above autothreshold of Ch2), 0.318
Manders' tM2 (Above autothreshold of Ch1), 0.322
Kendall's Tau-b rank correlation value, 0.8961
Costes P-Value, 1.00
Costes Shuffled Mean, -0.01
Costes Shuffled Std.D., 0.03
Ratio of rand. Pearsons >= actual Pearsons value , 0.00