Guide for making figures that include micrographs..
Take the time to make your figures look good from the first step. You probably have hundreds of images, but you are only going to show one or two or a handful at most. So make them look good.
We spend a lot of effort in last minute rush fixing errors. Why not get it right the first time?
Why not ask for advice or lessons before you start?
Read the journal guidelines before making figures.
Never save pictures as JPEG.
Avoid Powerpoint. Actually, just don't use it.
Photoshop is best program for figures that have pictures. Illustrator may have advanced design features, but you don't need them for a simple grid of images with text, arrows, and maybe lines. Photoshop gives you far more flexibility on how to handle the images and the images are the important part of the figure.
One argument against Illustrator: With Photoshop you can adjust the contrast of all images identically and on a per channel basis. Illustrator does not have this capability.
Work in RGB color space (unless the journal explicitly says you need to use CMYK). If you don't know what CMYK is, you should be using RGB. If you have to use CMYK and you don't know what this is, find somebody who is facile with CMYK before you start working with images, especially if the images have the color green in them.
Do not resize images.
If you have to resize images,
1.) Make them bigger
2.) Do not make them smaller
3.) Put an accurate scalebar onthe image before rescaling it so that the spatial scale will be preserved
If you can't wrap your head around the statement, "Make them bigger," talk to us before doing anything.
More on, "Make them bigger." One trick for making figures high enough resolution for most journals is to create a blank full page that is 300 PPI (or 600 PPI for the OCD) and make the figure as you would like it to look on the page. If you make a figure too big, it is easy to shrink; if you make it too small, blowing it up may be impossible if not just difficult.
Figure making can often be semiautomated. For instance, if you have four channel fluorescence images, putting each channel in its own box followed by different merge options can be automated. You don't have to copy and paste over and over and over and over again. Talk to us how to make this easy.
Scalebars. Micrographs should always have scalebars.
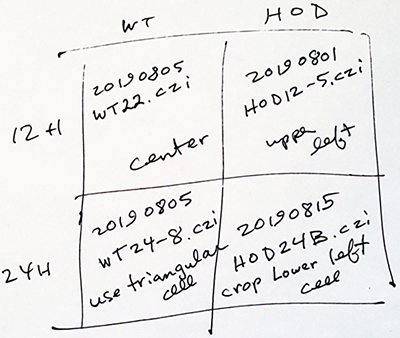
Save a lot of time by identifying the raw data before laying out the figure. Note the following has date and filename and suggested part of raw data image to use. This is especially important if someone else will be helping you.
More fancier stuff:
We can make most electron micrographs look better or show the features you need to illustrate better with a few simple legal tricks such as:
FFT filtering to reduce periodic camera noise
FFT filtering to reduce low frequency artefacts such as filament misalignment example here used on light microscopy images
Local contrast enhancement to delineate morphology example here
Matching contrast of pictures taken on different days, different magnifications, different preps...
Histology. Your color pictures should have been taken with the microscopy properly aligned to begin with, but we are realistic about how people really work. If you need help with color matching, dark corners, and other common problems, please talk to us.
Made a figure in PowerPoint and want to rescue it. A method for doing it here.